



Your competitors are chasing high-volume keywords. What if you could spot a trend before it explodes?
Most SEO strategies are reactive, they optimize for what’s already ranking. Google Trends lets you predict what’s next, surfacing keyword opportunities before your competitors even notice them.
Google Trends can help you:
↳ Catch rising trends before they peak.
↳ Skip keywords that are already dying out.
↳ Pinpoint seasonal spikes so you target the right keywords at the right time.
Here’s how I use it, step by step.
What Is Google Trends?
If you haven’t used it before, Google Trends is a free tool that shows popular search queries related to your business across regions and languages.
It works on an “interest over time” scale from 0 to 100, so you can quickly see whether a keyword is trending up, falling off, or holding steady. The chart itself is clean enough that a complete beginner can read it at a glance.
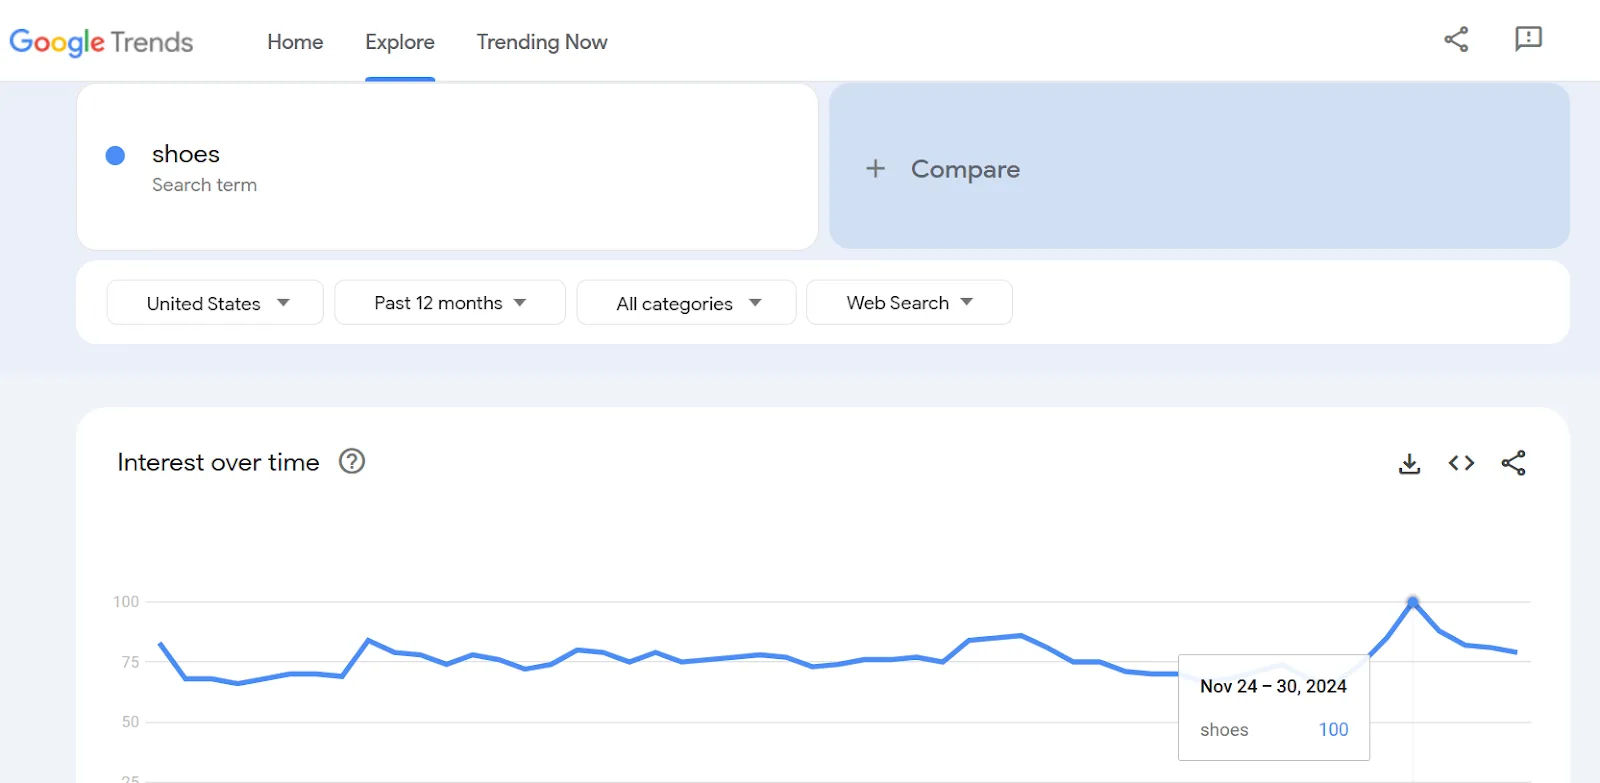
You can refine the data with filters to focus on specific regions and see how a keyword’s popularity shifts, or set a custom time frame, past week, past year, whatever, to zoom in on the patterns that actually matter.
Google Trends isn’t like your typical SEO tool though, so it’s worth understanding what it isn’t before you rely on it.
Google Trends Data Is NOT the Actual Search Volume
When I first started using Google Trends, I noticed a lot of people assume the graph represents a keyword’s search volume, the same kind of number you’d get from Google Keyword Planner. It doesn’t work that way.

Here’s the actual difference:
↳ Google Keyword Planner shows average search volume for a keyword over a given period.
↳ Google Trends shows relative popularity, how often a term is searched compared to other searches.
Trends also filters out repeated searches from the same person to keep the picture clean. If a term isn’t popular enough, it might just show up as 0.
How Google Trends Calculates Its Data
Rather than showing raw numbers, Google Trends adjusts the data to make comparisons easier: each data point gets divided by total searches for that region and time range, then scaled from 0 to 100.
In short, it shows how popular a query is relative to everything else being searched, not the literal number of searches.
How to Use Google Trends for Keyword Research
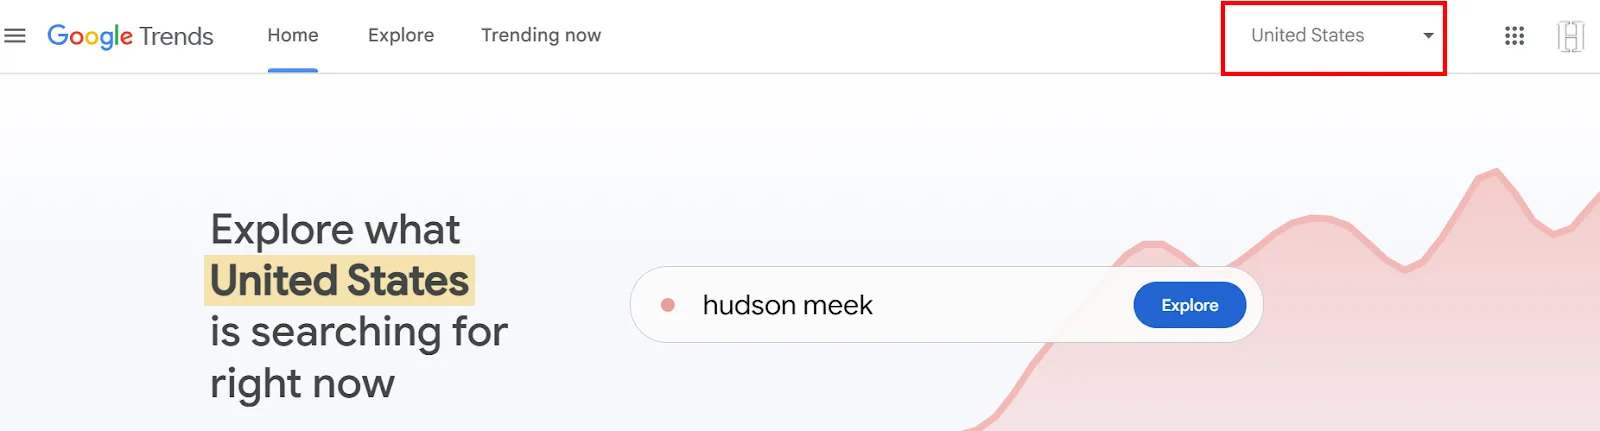
Head to the Google Trends website. In the top-right corner, next to your profile icon, you’ll see a small dropdown showing your location.
Click it to select your desired location (you can change this anytime). I picked the United States.
Type your keyword into the search bar. I’ll use “coffee shop” as an example.
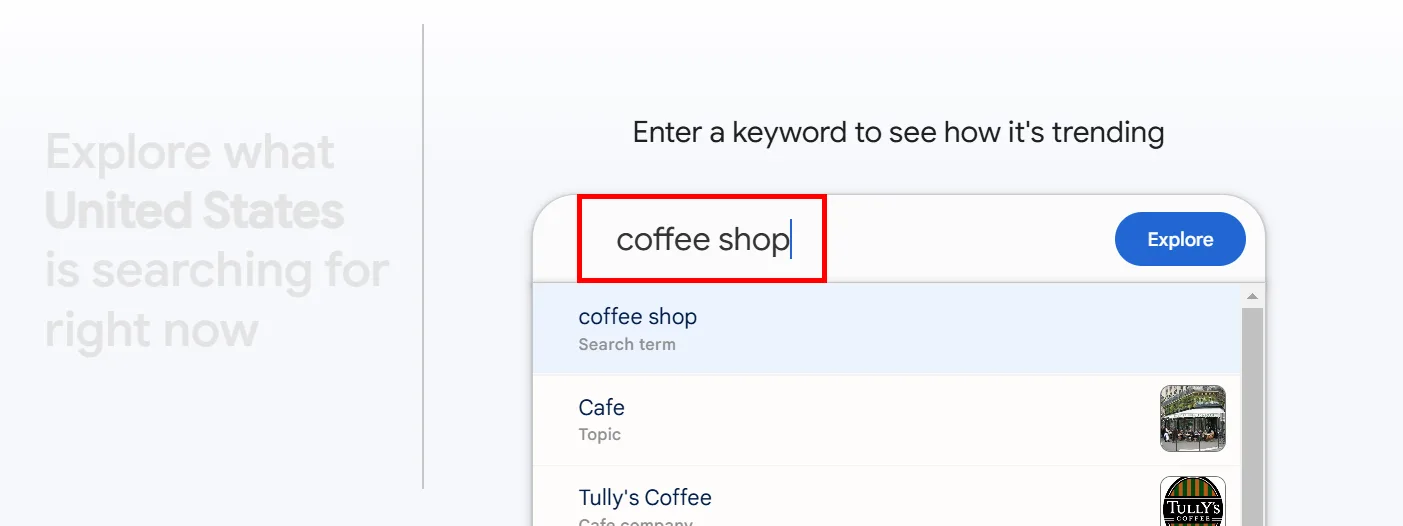
Press Enter or click Explore, and you’ll see a graph like this:
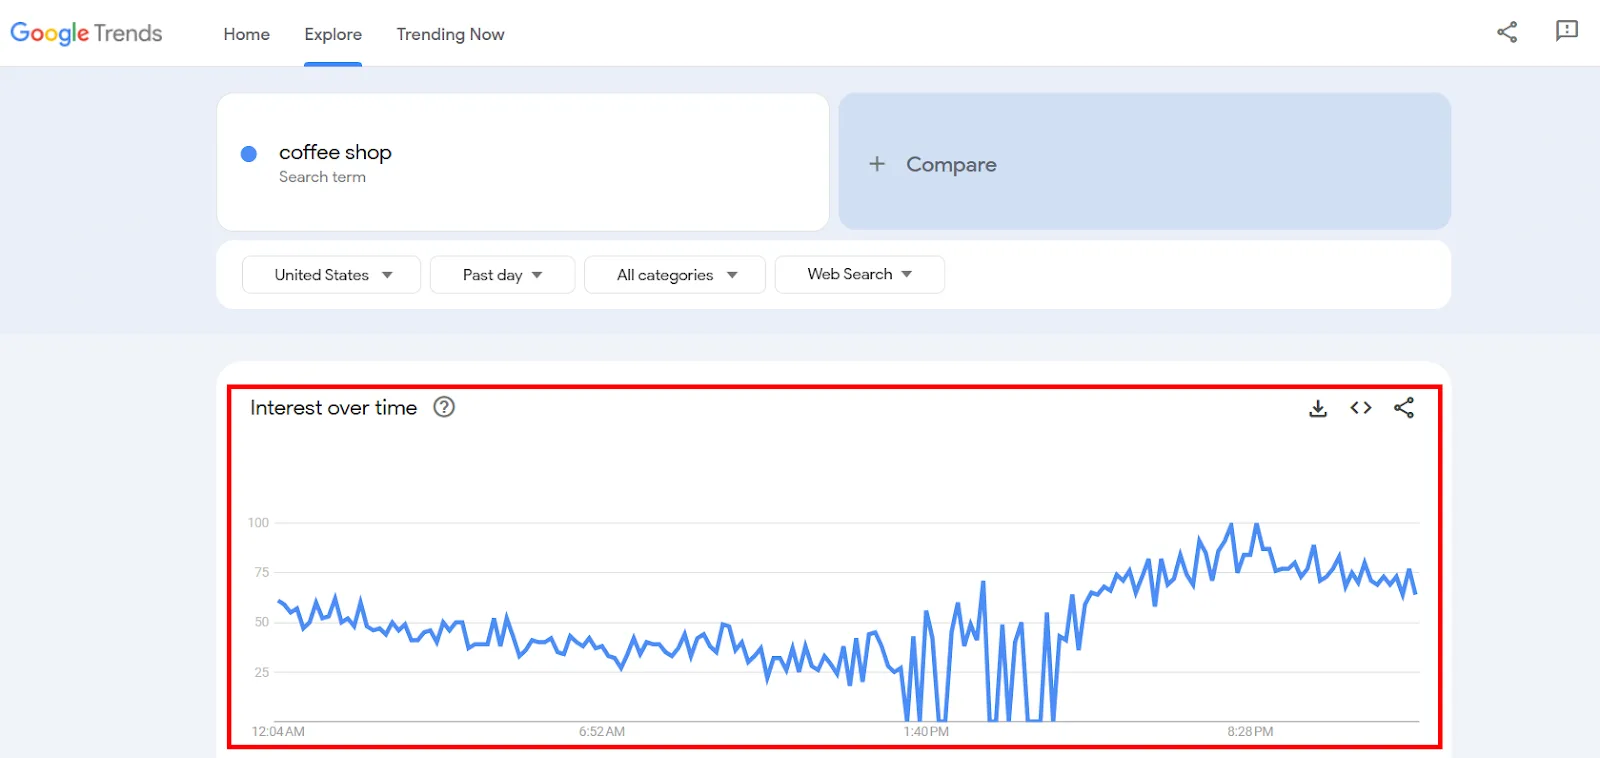
Interest in “coffee shop” spiked in the evening here, possibly for a few reasons:
→ Evening browsing habits: more people are online after work or school.
→ After-dinner cravings: people deciding where to grab coffee or dessert.
→ Planning ahead: searching for a spot to visit the next morning.
→ Evening social plans: late-night meetups or study sessions.
Google Trends won’t tell you which of these is actually true, it doesn’t explain why a keyword is trending. For that, you’ll need a tool like Semrush or Ahrefs to dig into intent.
What Trends does give you is a set of built-in filters to sharpen the results. You’ll see four of them under your search term, in the top-left corner:

Location, Time, Category, and Channel. Here’s how I use each one.
Location narrows results to a region. Select Worldwide for the broadest picture, or a specific country/city for something more localized.
Time sets your desired window, anywhere from the past hour to 2004-Present, or a custom range.
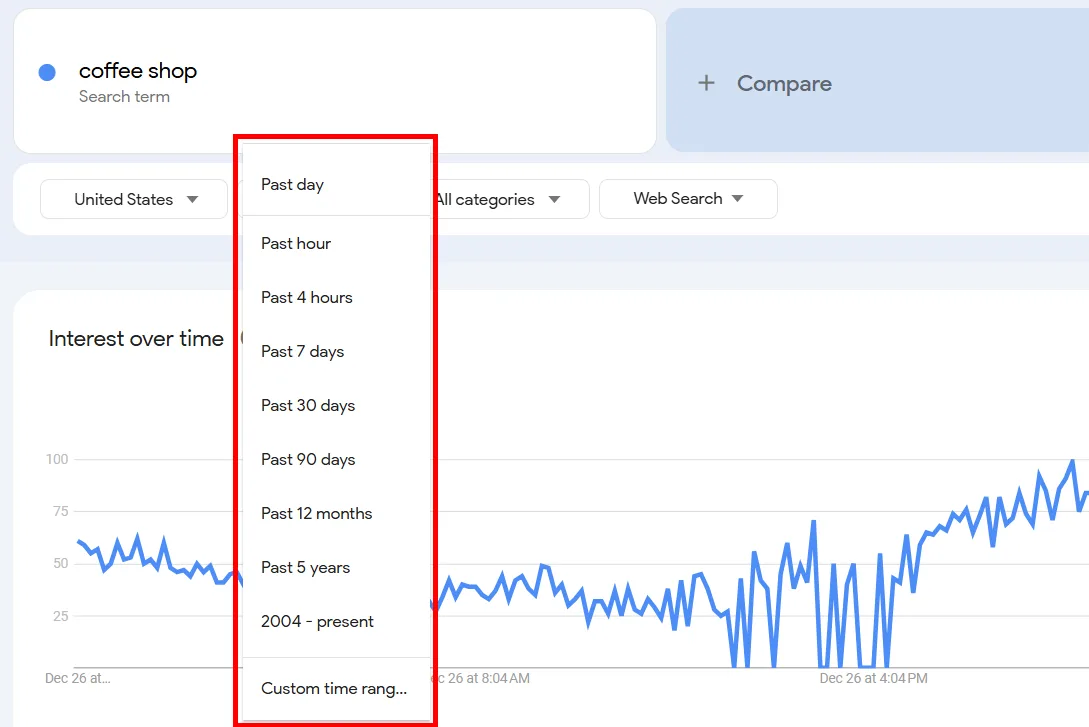
I picked Past 7 days.
Category narrows to a topic that fits your query, or leave it on All Categories for a wider net.
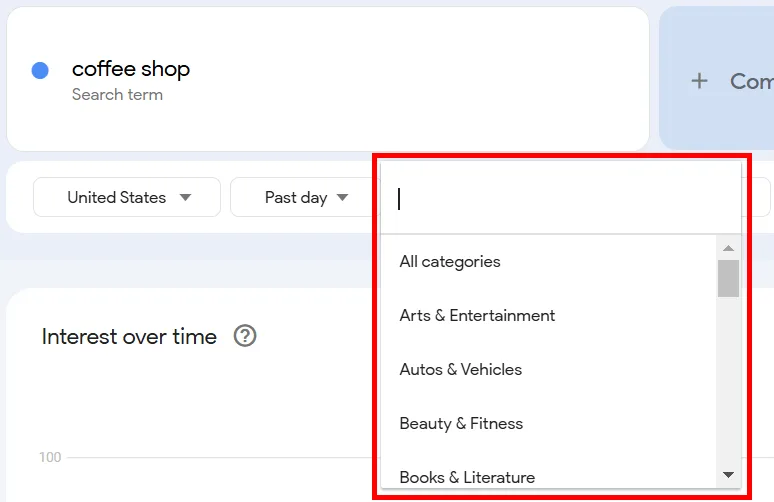
I chose Food & Drink. Hover any category and you’ll see an arrow appear, click it to reveal subcategories.
Channel lets you pick where you want to see keyword frequency, Web, Image, News, Shopping, or YouTube Search.
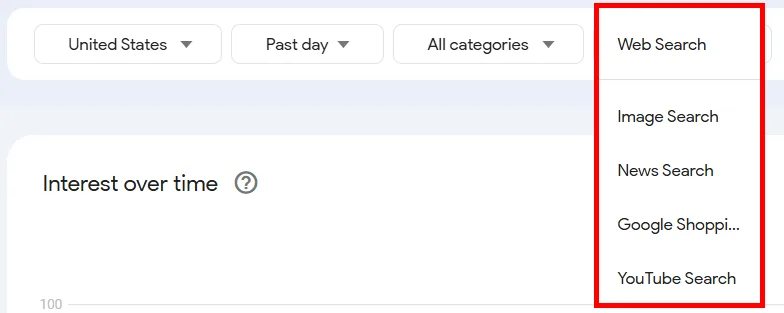
I selected YouTube Search. Every filter change reshapes the graph. With Worldwide, Past day, All categories, and Web Search selected, my “coffee shop” graph looked one way. Switch to United States, Past 7 days, Food & Drink, and YouTube Search, and it changed completely:
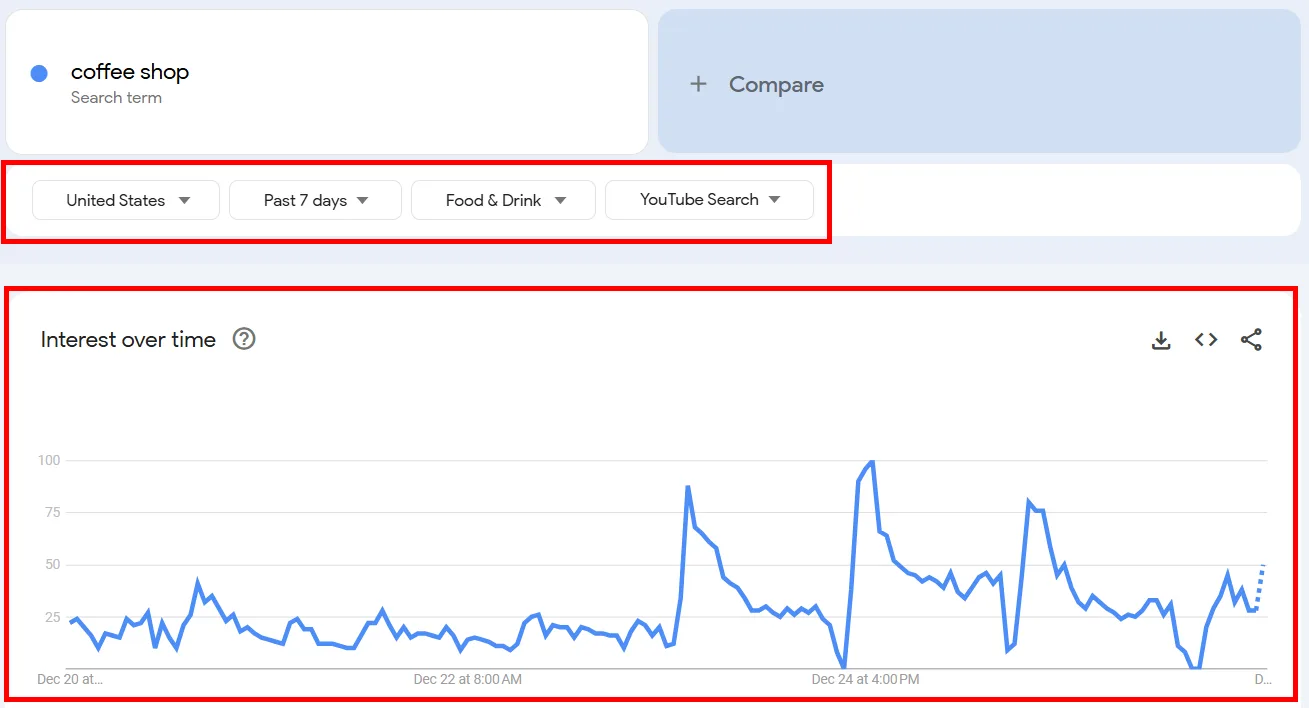
Expect that kind of shift with every filter tweak you make.
Scroll down to Interest by subregion to see a list of areas where your keyword performs well, each with a score from 0 to 100 (100 meaning most popular in that location). My “coffee shop” keyword scored 100 in Nevada and dropped to 16 in Kansas.
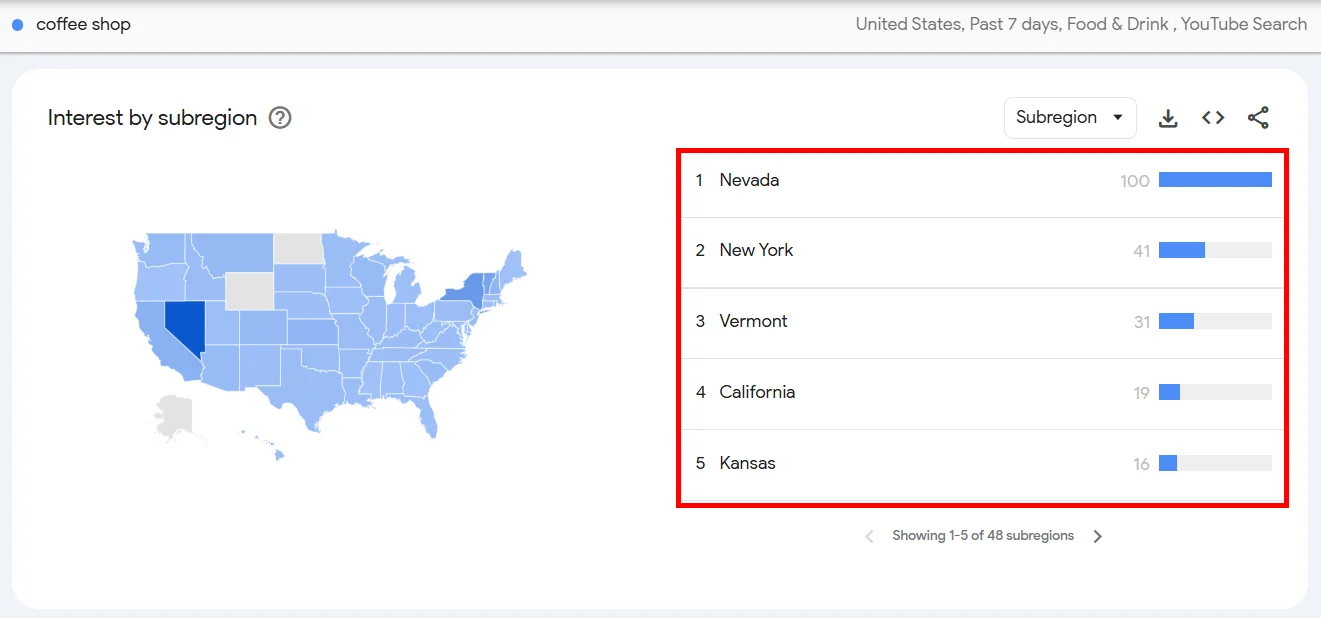
Click the Subregion dropdown in the top-right of that section for Subregion, Metro, or City views, each giving you a different slice of the same data.
Scroll further to Related topics and Related queries for keyword and query suggestions based on your term.
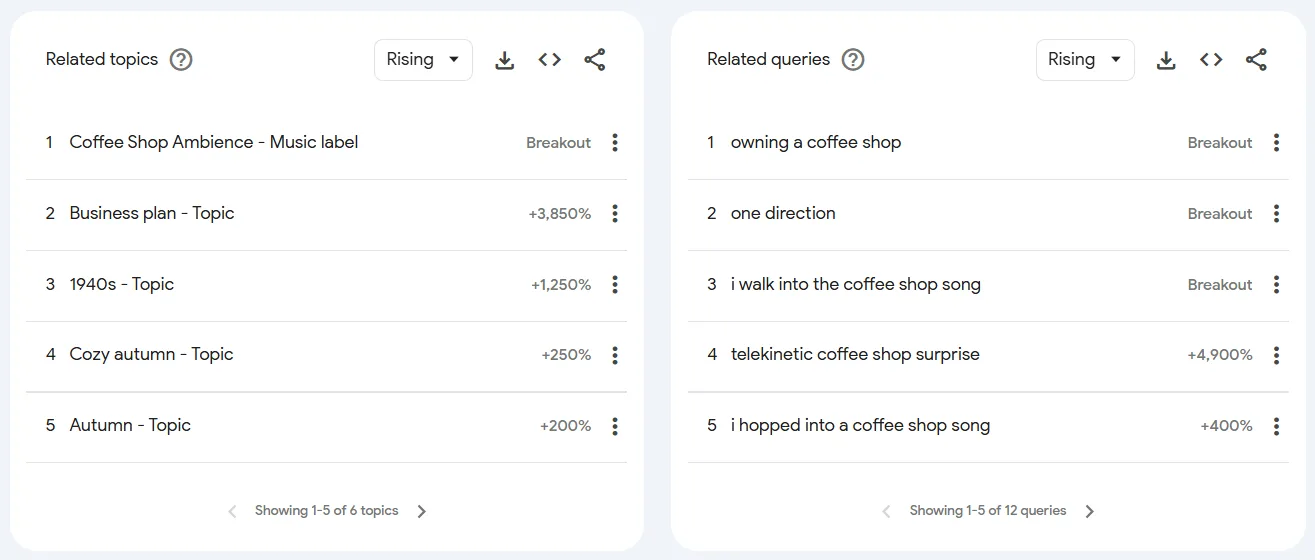
Click the Rising tab next to either section and select Top. Similar to the region report, this shows the top topics and queries for your chosen timeframe.
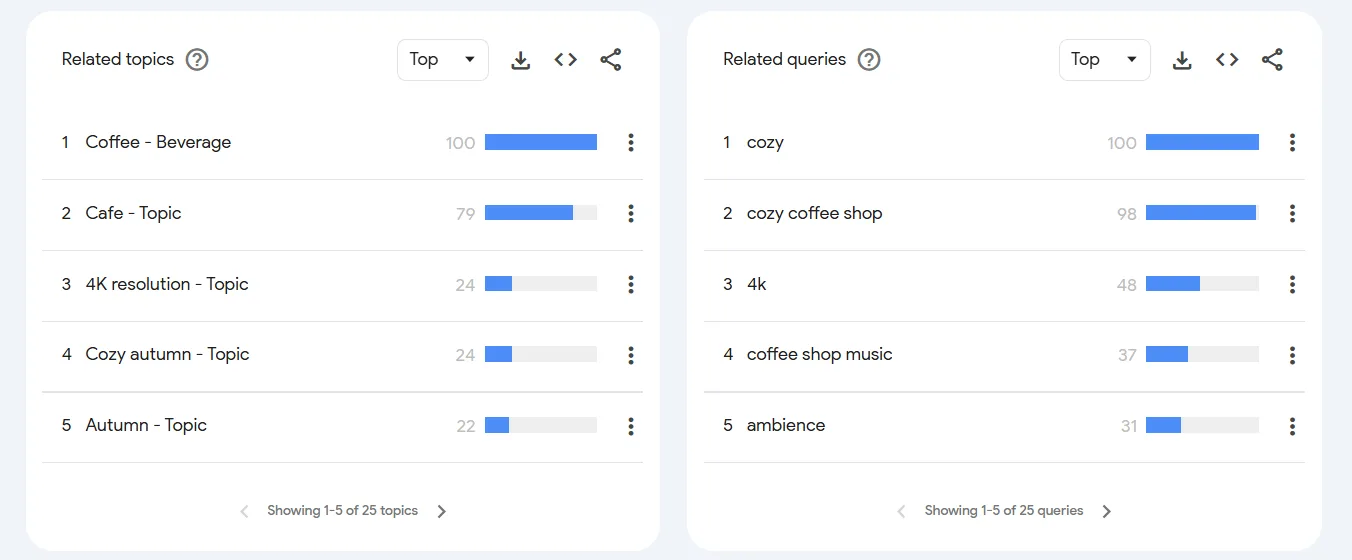
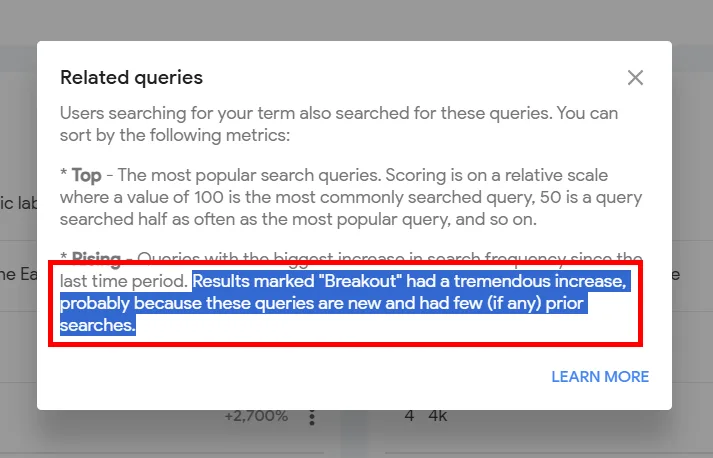
These made more sense for my research than what came up under Rising. If you see “Breakout” next to a query instead of a percentage, that’s a good sign, it means Google doesn’t have enough data to calculate a meaningful percentage change because the term is growing so fast.
You can also compare multiple terms directly. Click Compare at the top and add another keyword. I added “cafe” to compare against “coffee shop”:
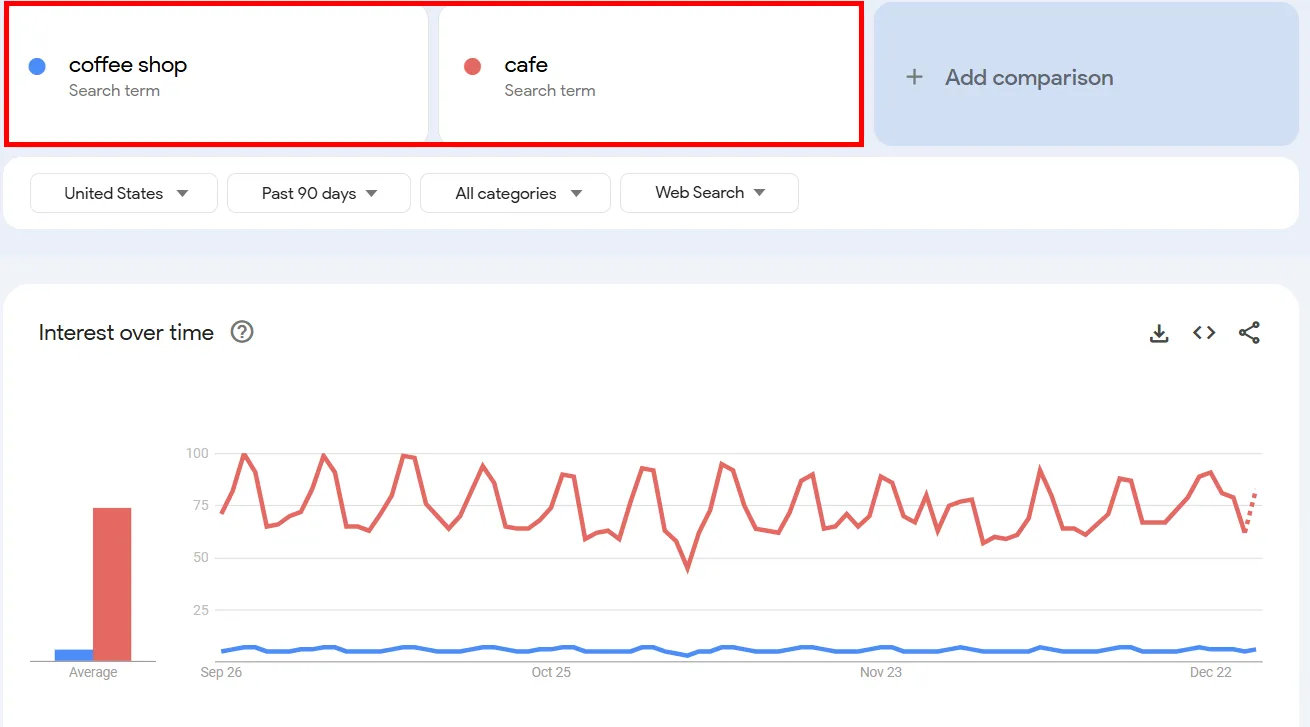
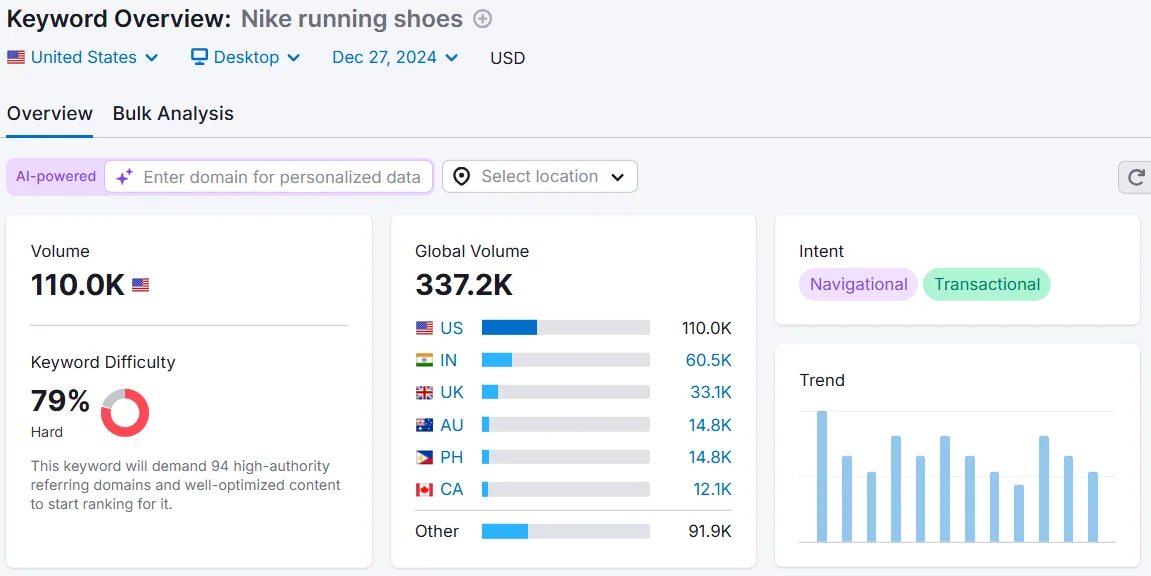
“Cafe” came out clearly ahead here. The downside of Trends is that it won’t give you exact search volume or keyword difficulty, both of which matter for SEO decisions. That’s why I pair it with Semrush’s Keyword Overview tool, plug in the keywords, hit Search, and get volume and difficulty to round out the picture.
7 Ways I Use Google Trends After Keyword Research
Once you have a list of valuable keywords, here’s how I put Google Trends to work beyond just finding them.
1. Create Topic Clusters
Topic clusters organize content around a central pillar with related subtopics branching off it, which keeps your site structured and strengthens internal linking.
Say you run an online shoe store and your pillar topic is “best running shoes.” Search that term in Google Trends and check Related topics and Related queries.
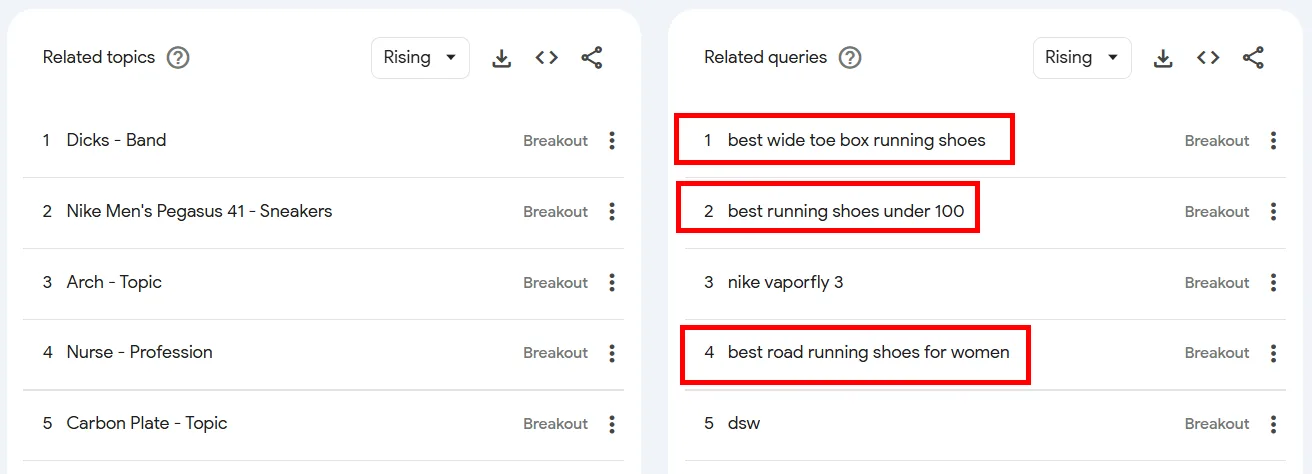
You might land on subtopics like “best road running shoes for women,” “best wide toe box running shoes,” or “best running shoes under 100”, each a solid blog post idea in its own right.
2. Discover Video Topics With YouTube Search Trends
Most people default to Google Search for Trends, but it’s just as useful for YouTube keyword research. The first step to ranking on YouTube is finding topics your audience actually cares about.
Say your channel covers footwear. Enter “running shoes,” switch the default Web Search filter to YouTube Search, and set the category to something matching your theme, Shopping, in this case.
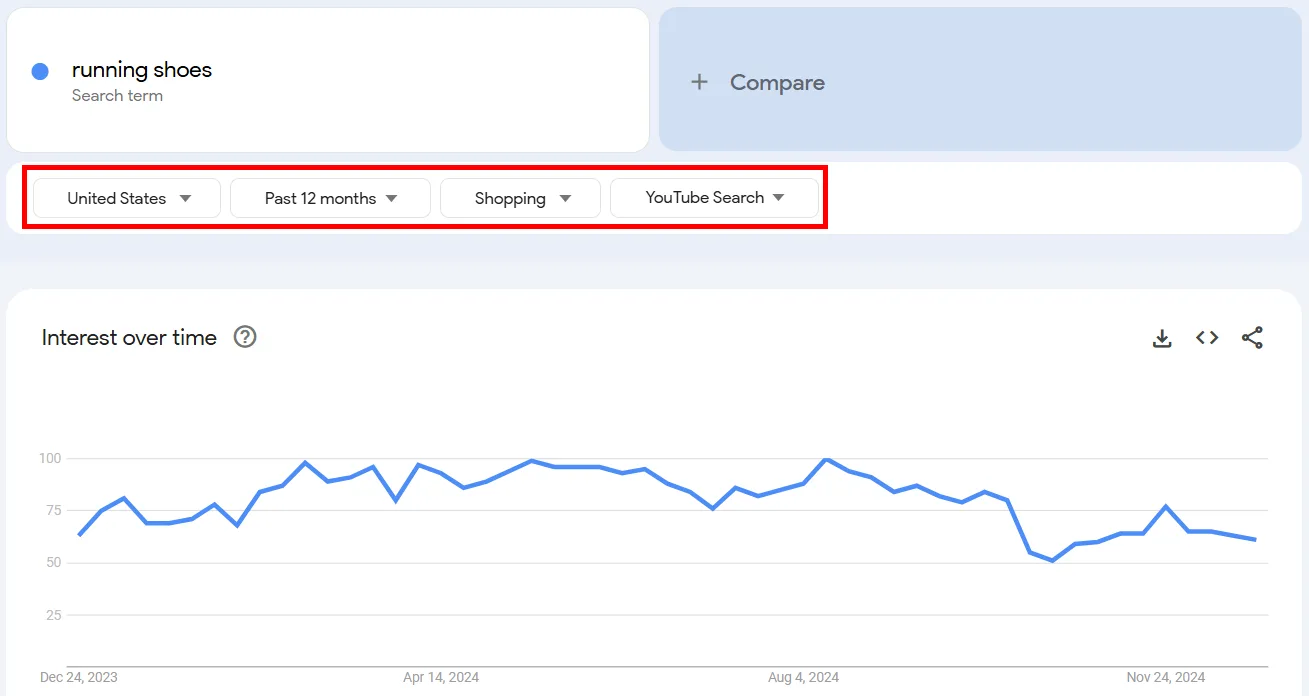
A stable or growing trend signals a good topic for video content. Scroll to Related topics and Related queries for more video ideas.
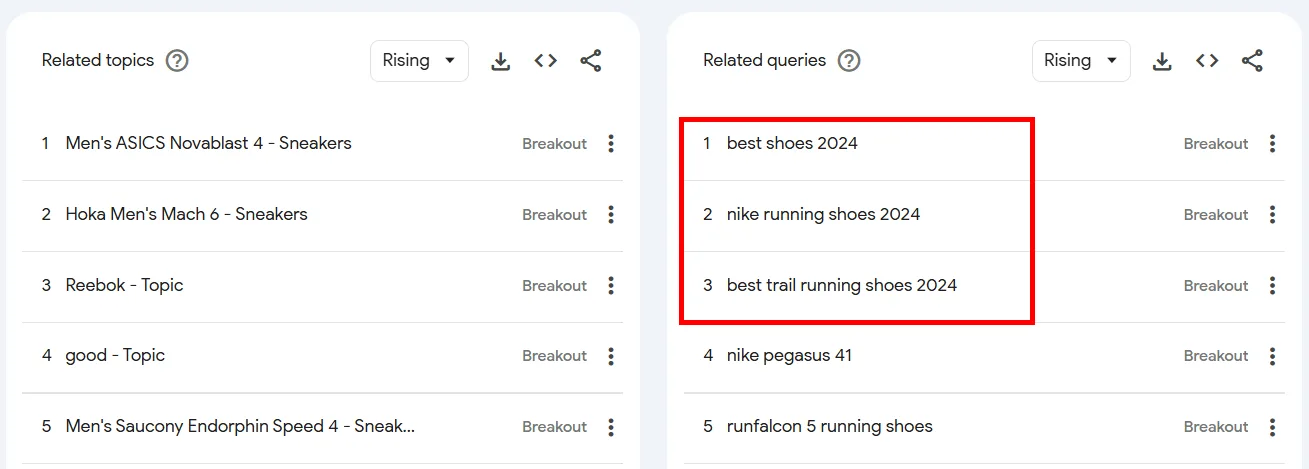
You could build videos around any of these, showcasing bestselling footwear along the way.
3. Optimize Your Local or International SEO
If you’re chasing qualified leads, don’t skip location-based searches. I always turn to the Interest by subregion feature when researching for a local or international business.
Say you sell running shoes and want to know which U.S. states care the most. Enter “running shoes” and check Interest by subregion.
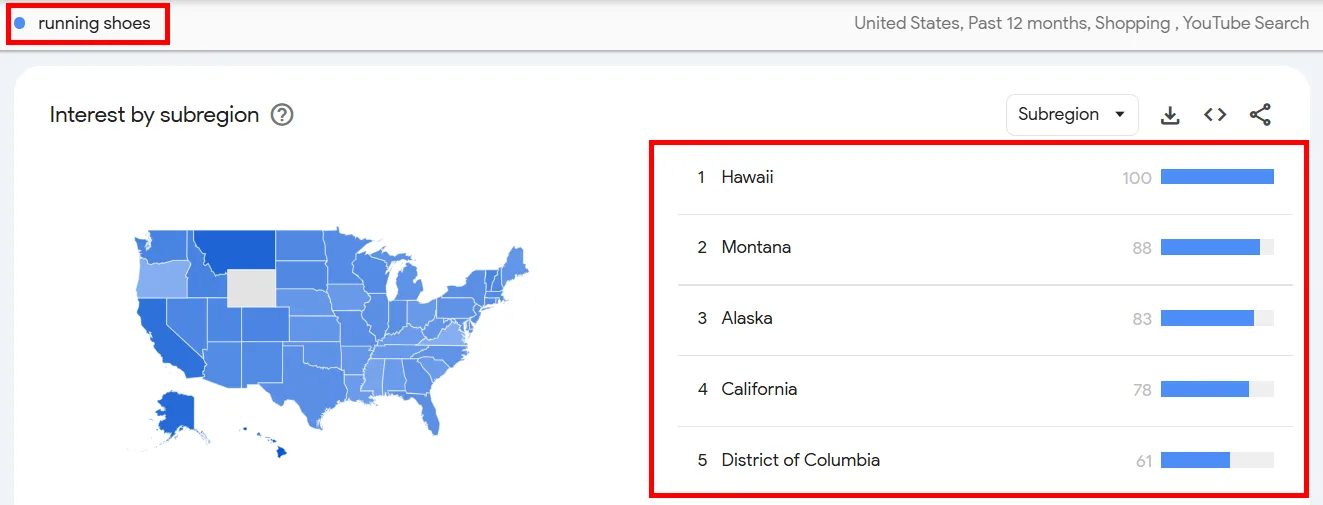
For “running shoes,” the highest interest showed up in the District of Columbia, California, Montana, Hawaii, and Alaska, likely a mix of outdoor lifestyle states (Hawaii, Montana, Alaska) and fitness-focused hubs (California, D.C.).
For city-level data, switch the Subregion dropdown to City.
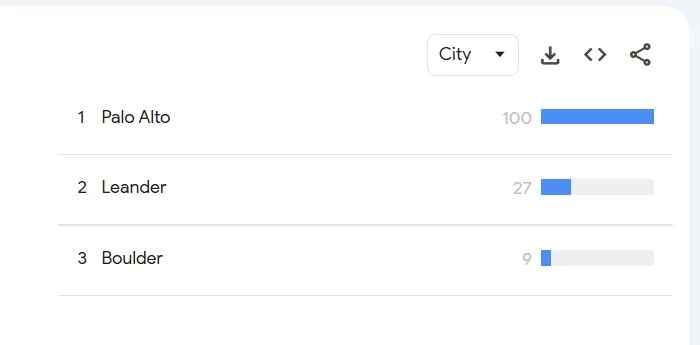
With this data in hand:
↳ Target specific regions with ads. Instead of running ads across the whole country, focus spend on the cities or regions with the highest search interest, Hawaii and Montana, in my example.
↳ Create location-focused content. An article like “Best Running Trails in Montana and the Shoes You Need” speaks directly to that audience.
You can also compare interest across locations directly. Type the same term into the Compare box, click the three-dot icon next to a search term, and select Change filters.
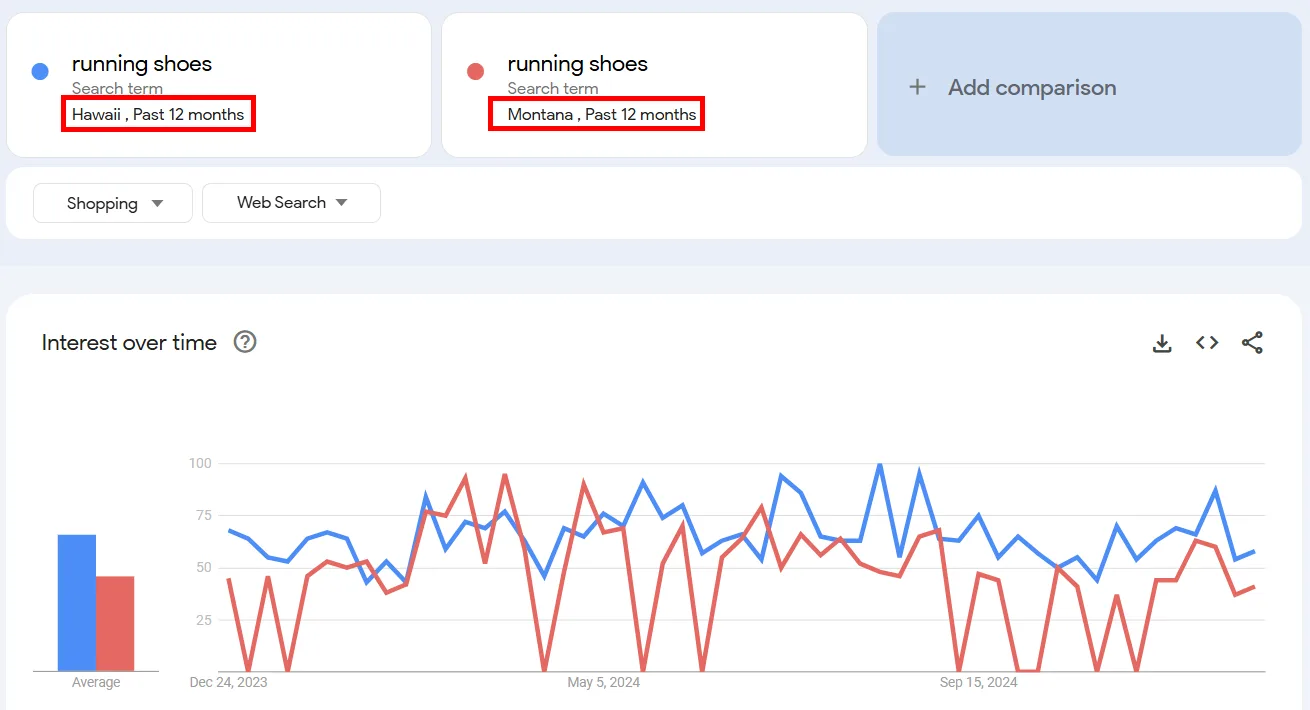
Comparing Hawaii and Montana for “running shoes” showed Hawaii with more overall searches, but similar relative trends in both, meaning the keyword is just as popular relative to each state’s population.
4. Find Seasonal Trends (or Check a Topic’s Seasonality)
A smart marketing calendar taps into seasonal spikes, holidays, specific times of year, to boost sales and traffic. If you sell running shoes, you might expect a jump around marathon season or New Year’s fitness resolutions. Google Trends lets you confirm it.
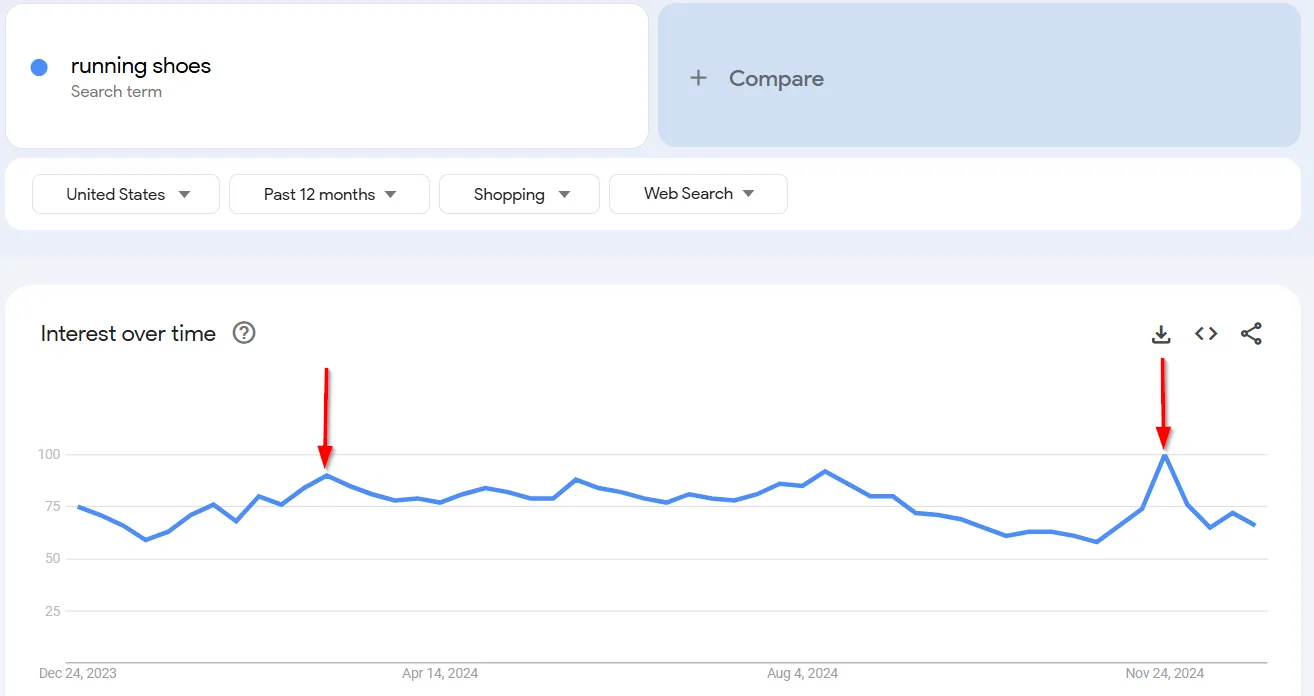
Searching “running shoes,” I noticed two spikes: March, likely spring marathon season, and November, possibly gift shopping ahead of the holidays. Once you spot a pattern like that, adjust accordingly:

↳ Run limited-time discounts or promotions around the spike.
↳ Increase paid ad budget during that window.
↳ Publish something timely, like “How to Choose the Best Running Shoes for Marathon Training.”
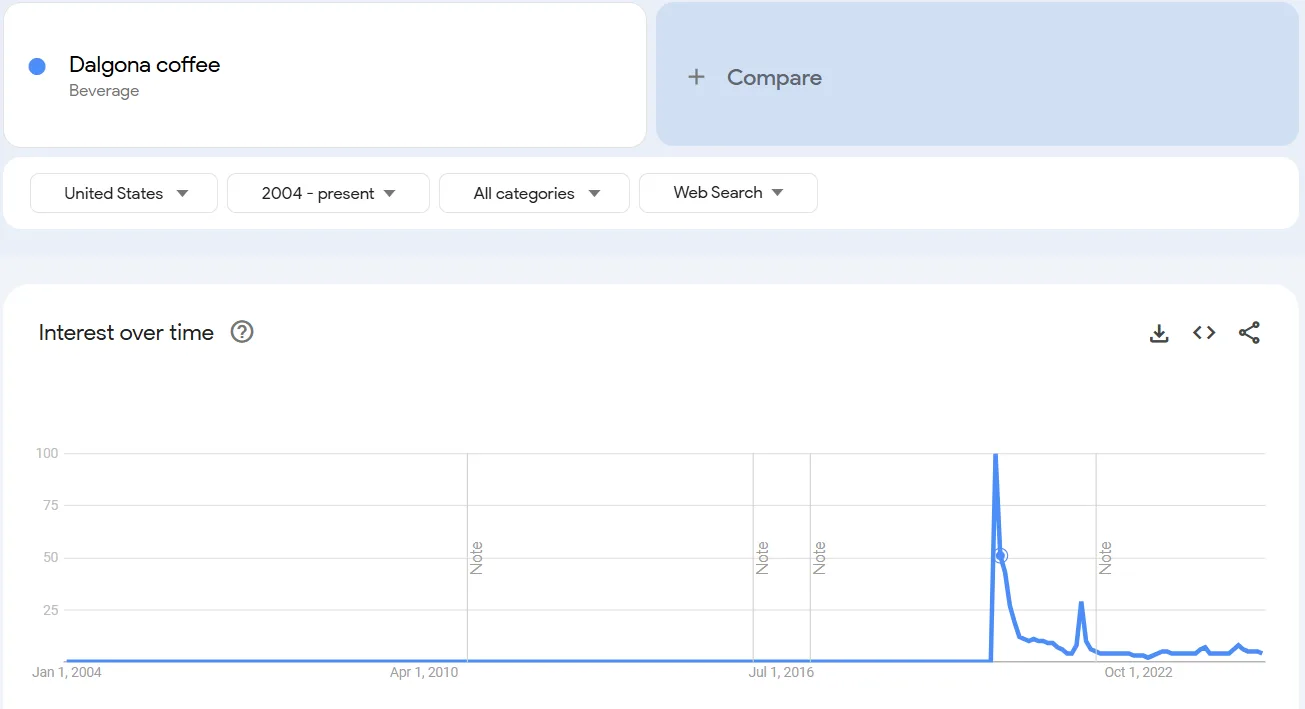
Content like that can drive traffic year after year with minimal upkeep. Just be sure to tell recurring trends apart from short-lived fads. “Hot chocolate recipes” spikes reliably every winter, while something like Dalgona coffee was a fad that faded fast after its 2020 peak.
5. Plan Your Content Calendar
Google Trends is also handy for planning content well ahead of time. Take “Black Friday.” Checked over five years, the spike lands at roughly the same point every year: late November.
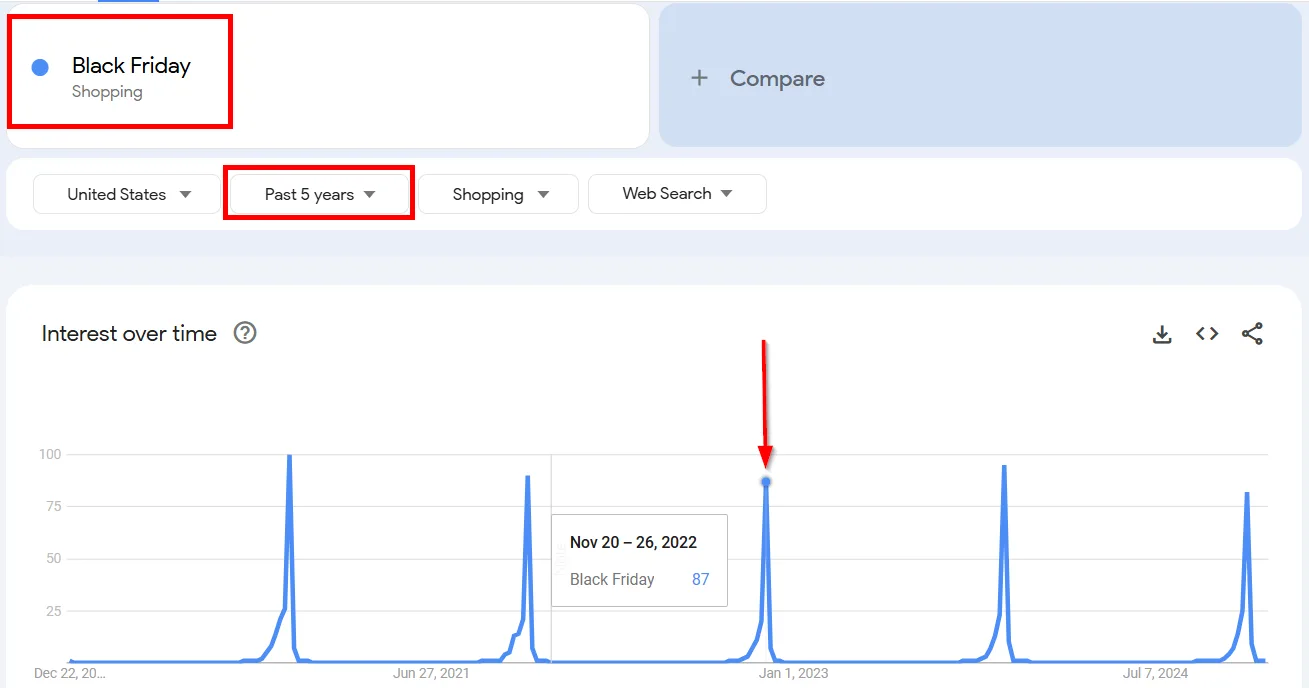
That makes sense, Black Friday always falls the day after Thanksgiving. If you run an e-commerce deals site, note that in your editorial calendar and publish something like “Top Black Friday Deals to Watch Out For” just ahead of the surge.
Now check “hot chocolate.” You’ll see a reliable spike every late fall through December, peaking around Christmas.
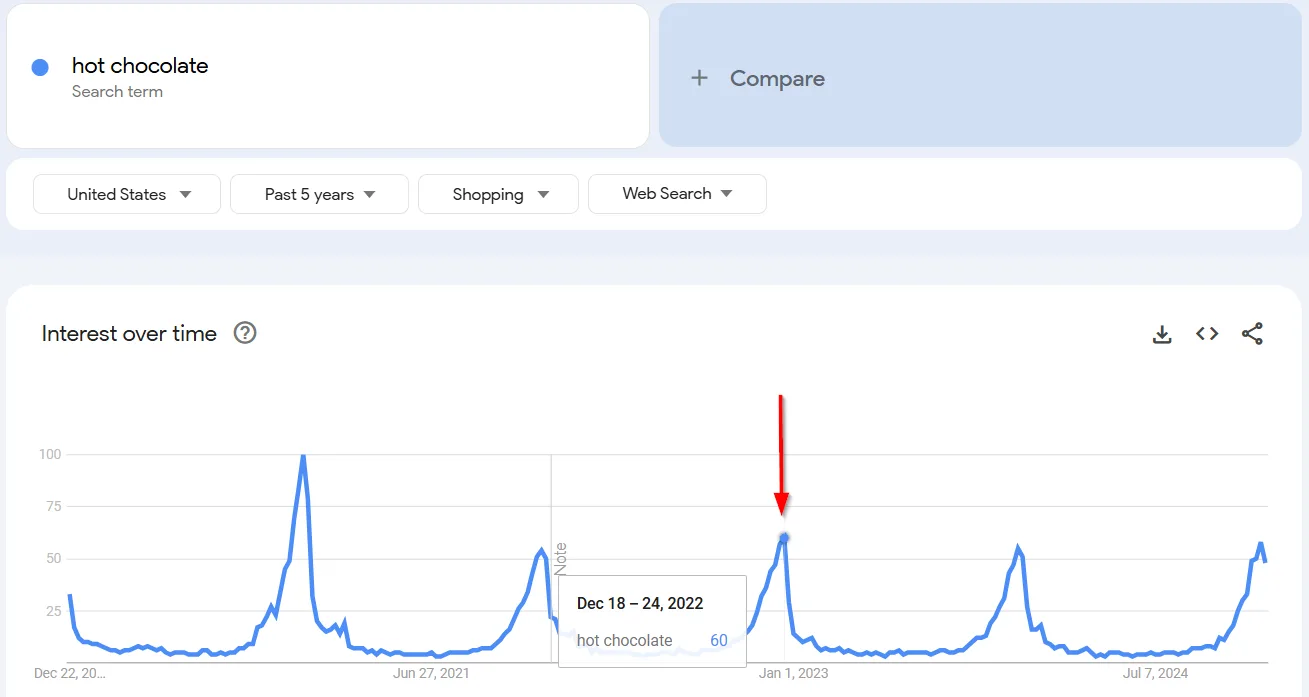
Rather than writing a new post every year, it’s more efficient to build one evergreen piece, “The Ultimate Hot Chocolate Guide”, and refresh it annually with new recipes, photos, or tips.
One more example: “ugly Christmas sweater” spikes hard every December, right in time for holiday parties.
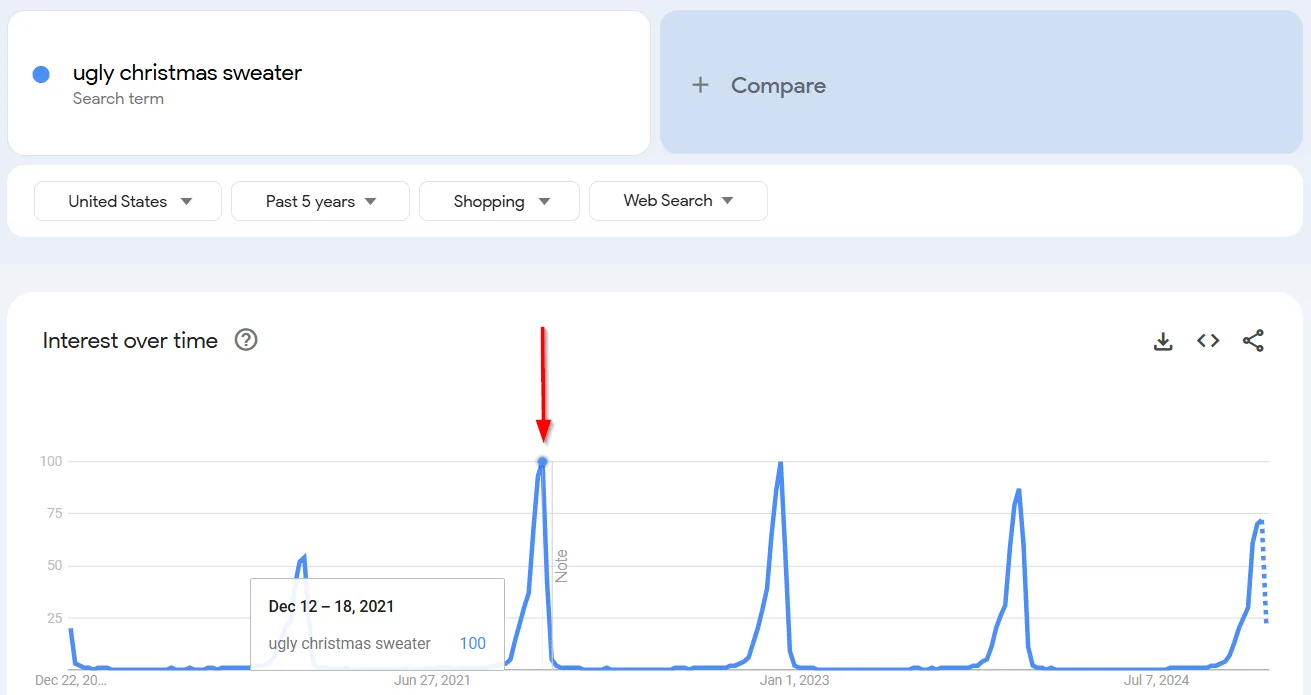
Publish a “Top X Ugly Sweaters for 20XX” list every December, or just refresh last year’s post with new picks. Spotting patterns like these is what lets you plan content around actual peak demand instead of guessing.
6. Keep Tabs on How You Stack Up Against Competitors
Knowing how you compare to competing brands sharpens your own strategy, and the Compare feature is a quick way to start. Say you run a growing sports footwear company and want to see how you stack up against Nike and Adidas.
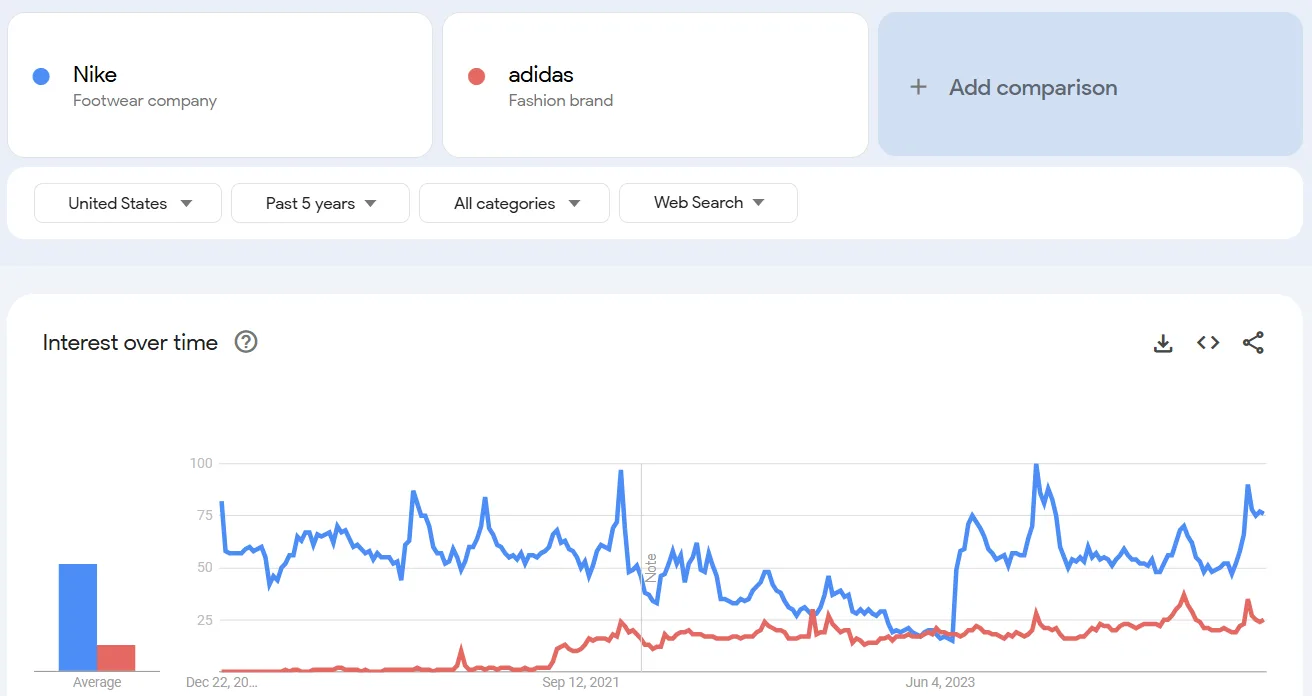
Setting the timeframe to a few years back showed Adidas holding fairly steady while Nike had noticeable dips and spikes, likely tied to product launches or promotions, plus a shared bump around the holiday shopping season for both. If a competitor spikes and you don’t, ask what they were doing differently, and whether you can adapt something similar.
From there, open Semrush Market Explorer (under the Trends tab), enter three competitor sites, and click Create and analyze.
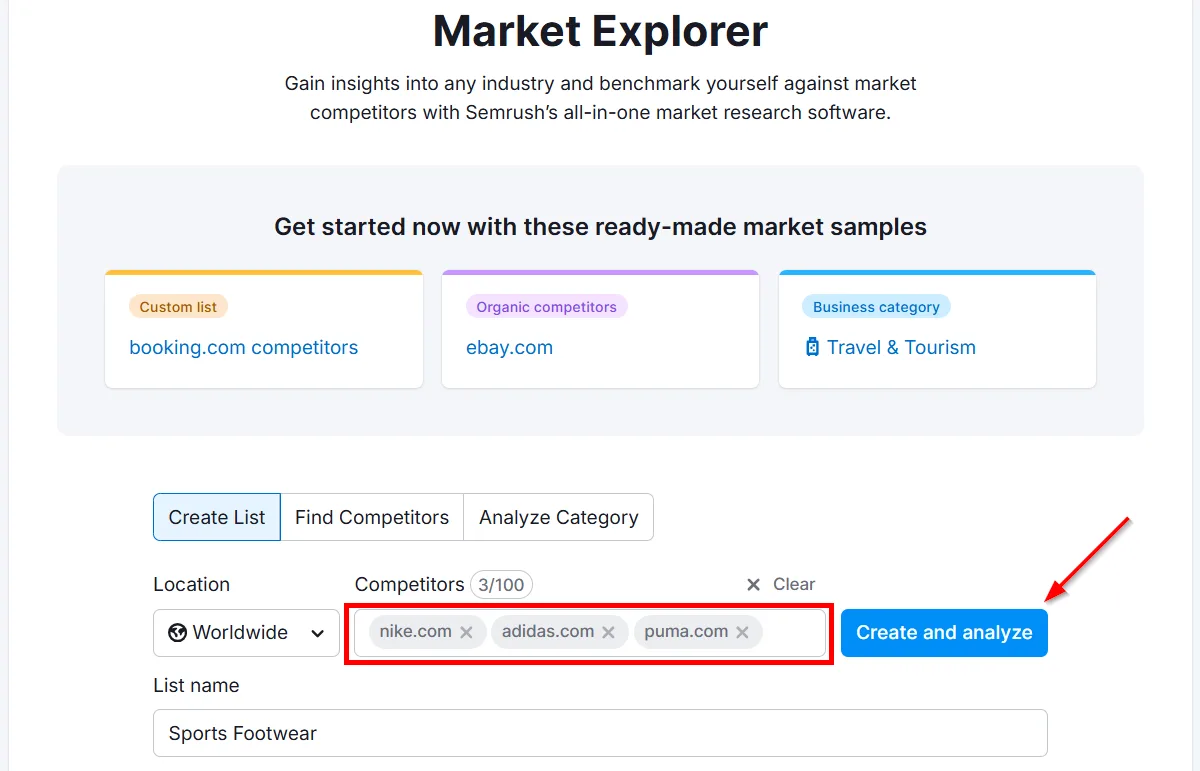
Scroll to Top Keywords to see what generated the most traffic during that window.
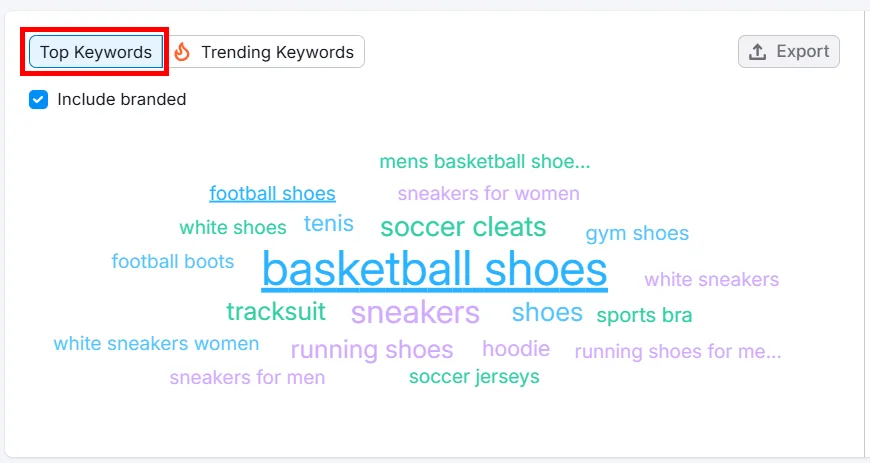
Or select Trending Keywords to find the terms with the biggest volume increases in that range, hovering over each for more insight into emerging opportunities.
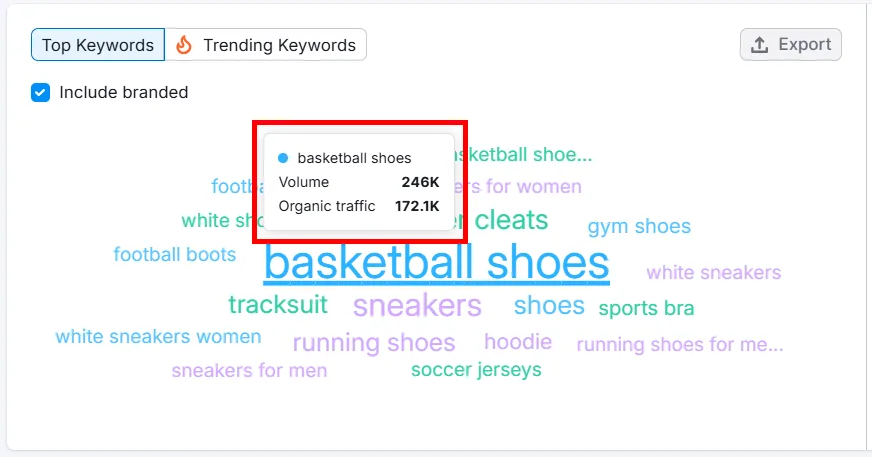
Tracking competitor moves this way helps you catch emerging trends early and shape your own content accordingly.
7. Find Brand-New Keyword Ideas
A lesser-known trick is the Trending Now feature. You don’t need to search a specific keyword, it shows real-time data on topics with a sharp spike in searches over the last 24 hours.
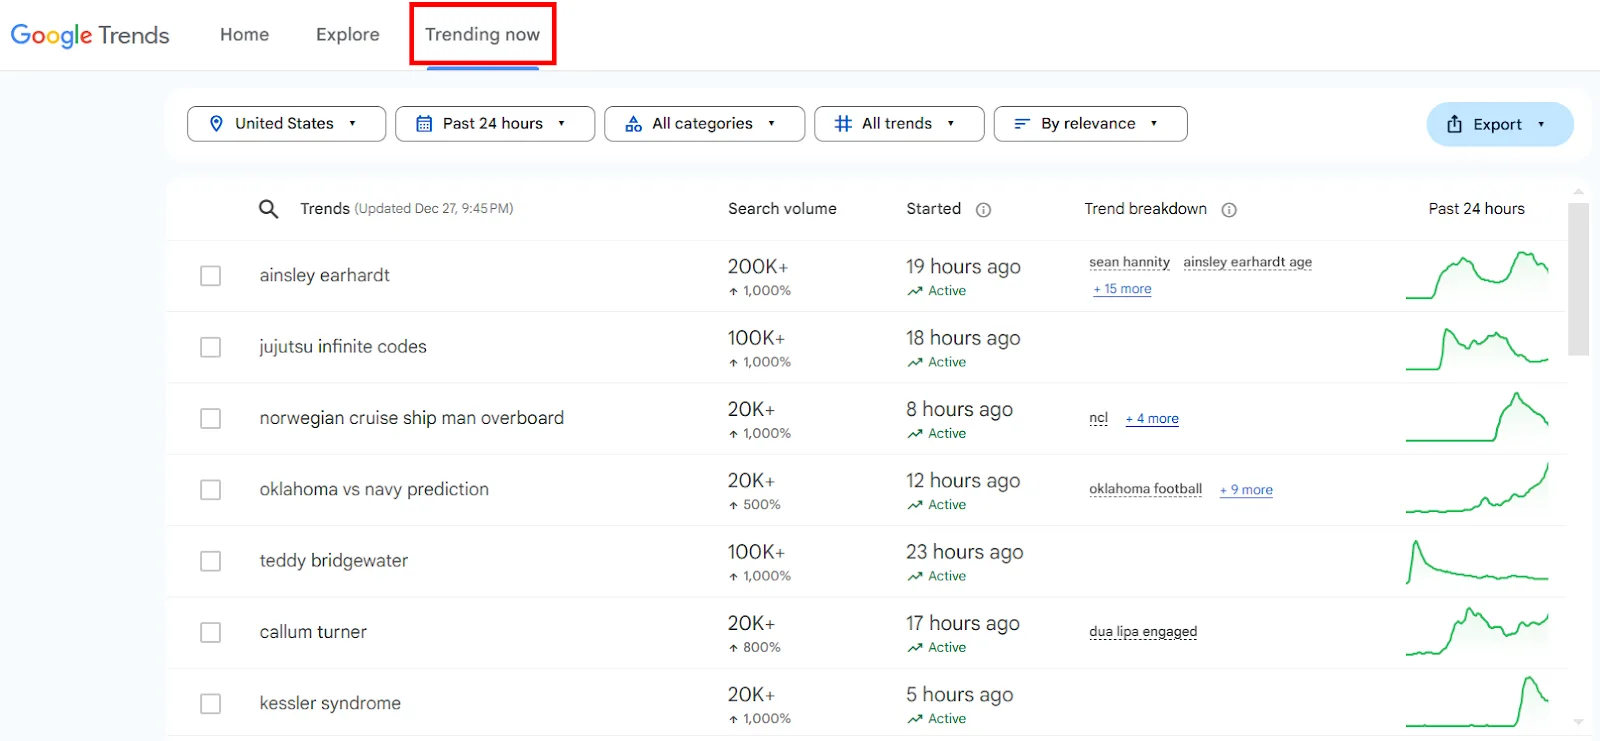
Fair warning: a lot of these surging terms are short-lived, viral news or celebrity gossip, and rarely worth building content around. But every so often you’ll spot something with real staying power. A few years back I caught “PS5” gaining traction early, before it showed up in most traditional keyword tools.
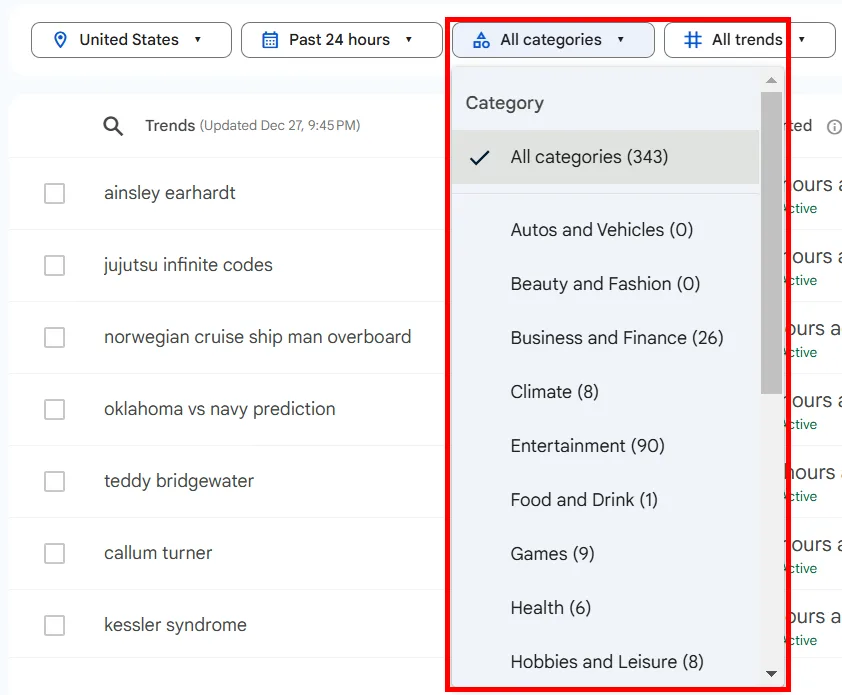
Use the Category dropdown in Trending Searches to filter to your industry, it cuts out unrelated noise and surfaces emerging topics worth covering.
Why Use Google Trends?
Before I found Google Trends, I leaned a lot on gut feeling and secondhand advice for keyword research. Sometimes it worked, sometimes my content just fell flat.
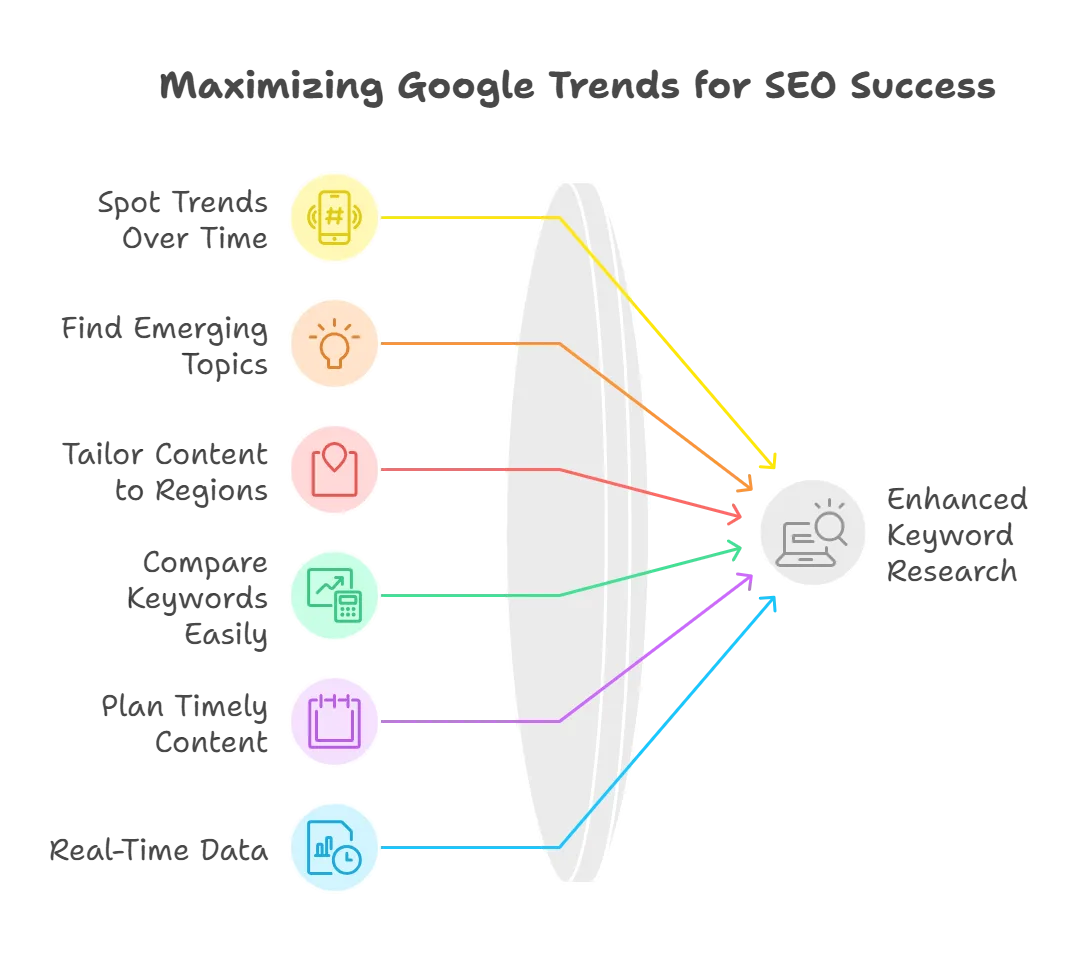
↳ It shows how interest in a keyword shifts, helpful for planning seasonal peaks or deciding whether a term is worth long-term investment.
↳ “Breakout” labels on Related Queries flag sudden, significant spikes, letting you catch rising trends before competitors do.
↳ Interest by location lets you tune SEO or PPC spend toward the areas with the most demand.
↳ You can compare up to five terms side-by-side to prioritize what’s gaining traction.
↳ Knowing when people search for something helps align blog posts and campaigns with what’s actually relevant right now (my entire year’s seasonal content is planned around this).
↳ It’s fast, up-to-the-minute data for jumping on trending topics or watching a campaign in real time.
But Google Trends Has Its Limitations Too
↳ It shows trends, not exact numbers. You get a relative 0 to 100 score, not actual search volume. Pair it with Keyword Planner or Semrush for precise figures.
↳ It struggles with low-volume keywords. Niche or new terms might show no data at all, so you could miss real opportunities without a second tool.
↳ Historical data is limited for some terms. Trends goes back to 2004, but not every keyword has a detailed history, especially newer or less popular ones.
↳ It lacks context. The tool won’t tell you why a keyword is trending, you’ll need other tools to nail down intent.
↳ It’s Google-centric. Outside of a YouTube filter, it’s not much help for Bing, Amazon, or social platforms.
↳ Regional data isn’t always granular. For hyper-local SEO, low-volume areas may get lumped together, so you’ll need more targeted research.
↳ Short-term data can be volatile. Daily or hourly spikes might not reflect the bigger picture, so be cautious making decisions off them.
The takeaway: Google Trends shows relative data without much context, so pair it with other tools for a complete SEO strategy.
Turning Google “Trends” into Results
Google Trends is one of the best ways to find trending keywords and get ahead of your competition. For the best results, pair it with other Google SEO tools:
↳ How to Use Google Search Console for Keyword Research
↳ How to Get Local Keyword Search Volumes by City
↳ How to Do Keyword Research for Google Ads
Frequently Asked Questions
Is there a Google Trends API?
Google doesn’t offer an official API for Trends, but it provides two datasets: real-time (past week) and non-real-time (back to 2004). These are useful, though they require manual or third-party extraction. Unofficial workarounds exist but aren’t supported and can break without notice, so I wouldn’t rely on them.
How do Google Trends determine search interest?
It takes the total search volume for a query within a chosen timeframe and location, then compares it to overall search traffic. The result shows relative popularity, not exact numbers.
What does it mean when a keyword varies in Google Trends?
Usually it means the keyword’s popularity is seasonal or tied to external factors, like product launches, news events, or marketing campaigns.
Does Google Trends work for non-Google platforms (e.g., Amazon, Bing)?
Primarily, it reflects Google Search data, plus YouTube and Google Shopping. For Amazon or Bing insights, pair it with platform-specific tools like Amazon Best Sellers or Bing Webmaster Tools.
How can I find the most searched keywords on Google using Google Trends?
Enter a keyword or topic in the search box. Trends displays search interest over time on a 0-100 scale, higher numbers mean more searches. Use the Explore section to filter by time, location, and category, then look for keywords with high or rising popularity.
What are the trending searches on Google?
They change daily. Google’s Trending Now page shows real-time and daily snapshots of what’s popular, a quick way to spot events or viral topics your audience cares about.
What are the top 10 Google searches?
These change constantly. Check Google’s Year in Search for annual highlights, or the Trending Now section for what’s hot day to day.
How can I use Google Trends to find related topics and keywords?
After typing a main keyword into Explore, scroll to Related Topics and Related Queries. Watch for “Rising” or “Breakout” labels, they flag terms gaining momentum quickly, sometimes before the competition notices.
What if my keyword doesn’t show any data in Google Trends?
It might be too niche or too new. Try broadening the term, switching to a longer timeframe, or checking Related Topics. If that still doesn’t help, use a tool like Semrush or Ahrefs to check for hidden demand.
Can I use Google Trends alone for keyword research?
It’s great for spotting trends and seasonal patterns, but it doesn’t provide actual search volume, so I wouldn’t use it alone. Pair it with Semrush, Ahrefs, or Google Keyword Planner for volume and competition data.
Can I use Google Trends to research YouTube topics?
Yes. Switch the default Web Search filter to YouTube Search to see what’s trending on the platform, and compare different video ideas to gauge what’s likely to attract viewers.
How do I know if a trend is worth pursuing?
Check its interest over time. Steady or climbing signals long-term potential; a quick spike might fizzle before you can capitalize on it. Related Queries can also surface longer-tail variations that signal more lasting opportunity.
Can Google Trends help identify trends for content creation?
Absolutely. When you spot a rising or breakout query in your niche, build a blog post or video around it so your content is ready to capture traffic right as interest peaks.
What is the significance of the ‘Trending Now’ feature in Google Trends?
It’s a real-time pulse on public interest. If something relevant to your audience shows up there, it’s often worth producing new content, or boosting existing content, to ride that wave.
How can Google Trends assist in understanding the popularity of a product category?
Enter a broad category, like “running shoes,” and check the interest over time graph for spikes that align with seasonal events, new releases, or holiday shopping. That helps you time marketing campaigns for maximum impact.
Should I rely on Trending Now searches for content ideas?
Be selective. Many Trending Now searches are fleeting news stories or fads, but occasionally you’ll find something with real staying power. If a new term aligns with your niche, it’s worth digging into further.
When is the best time to publish seasonal content?
Look at the historical peaks for your keyword in Google Trends, then publish a few weeks ahead of that spike. That gives your content time to rank before demand surges.
Can Google Trends help with local SEO?
Yes. Use the Interest by Subregion feature to see where interest in your keyword is strongest, then target those areas with location-specific content or ads.
How often should I check Google Trends?
It depends on your niche. Fast-moving industries like tech or entertainment might warrant a weekly or even daily check. More stable industries, like B2B services, can usually get by with a monthly or quarterly review.
Can search data be compared between different terms on Google Trends?
Yes, the Compare feature lets you stack up to five keywords or brand names to see which dominates search interest over a given period.
How do I monitor competitors using Google Trends?
Use the Compare feature to track up to five competitors or related terms. Note spikes in their search interest and cross-check against their promotions, launches, or campaigns, then replicate or improve on what’s working.