Your competitors chase high-volume keywords. But what if you could spot trends before they explode?
Most SEO strategies are reactive – they optimize for what’s already ranking. But Google Trends lets you predict what’s next. It shows you hidden keyword opportunities before your competitors even notice them.
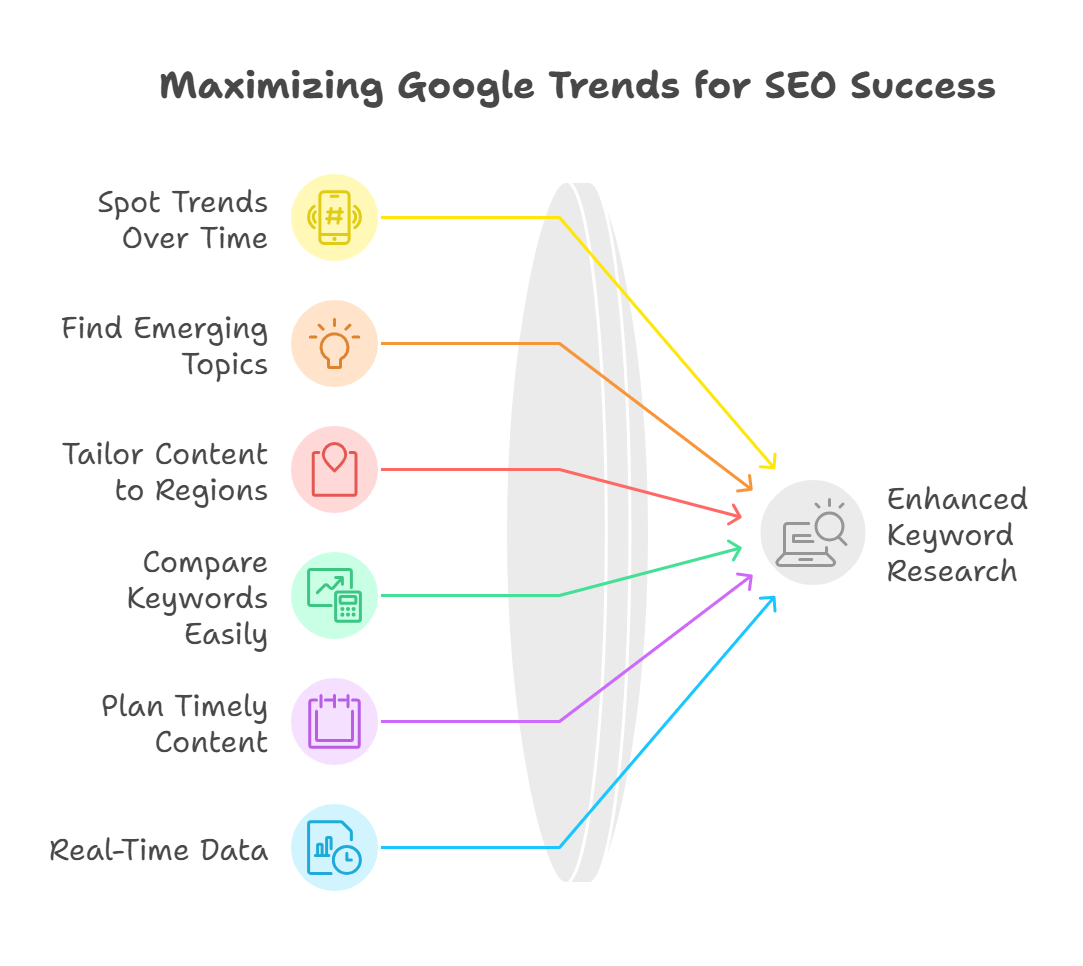
Google Trends can help you ⤵
↳ Catch rising trends before they peak.
↳ Avoid wasting time on keywords that are already dying out.
↳ Pinpoint seasonal spikes so you target keywords at the right time.
Want to rank before the competition even joins the race?
In this article, I will walk you step by step on how to use Google Trends to never miss one!
What is Google Trends?
If you haven’t used Google Trends before– it’s a free, easy to use Google tool that helps you find popular search queries related to your business across regions and languages.
It uses an “interest over time” scale from 0 to 100, making it easy to see if a keyword is trending up, falling off, or staying steady.
The best part– its clean and easy-to-read chart that even a complete beginner can understand.
Here’s how it looks:
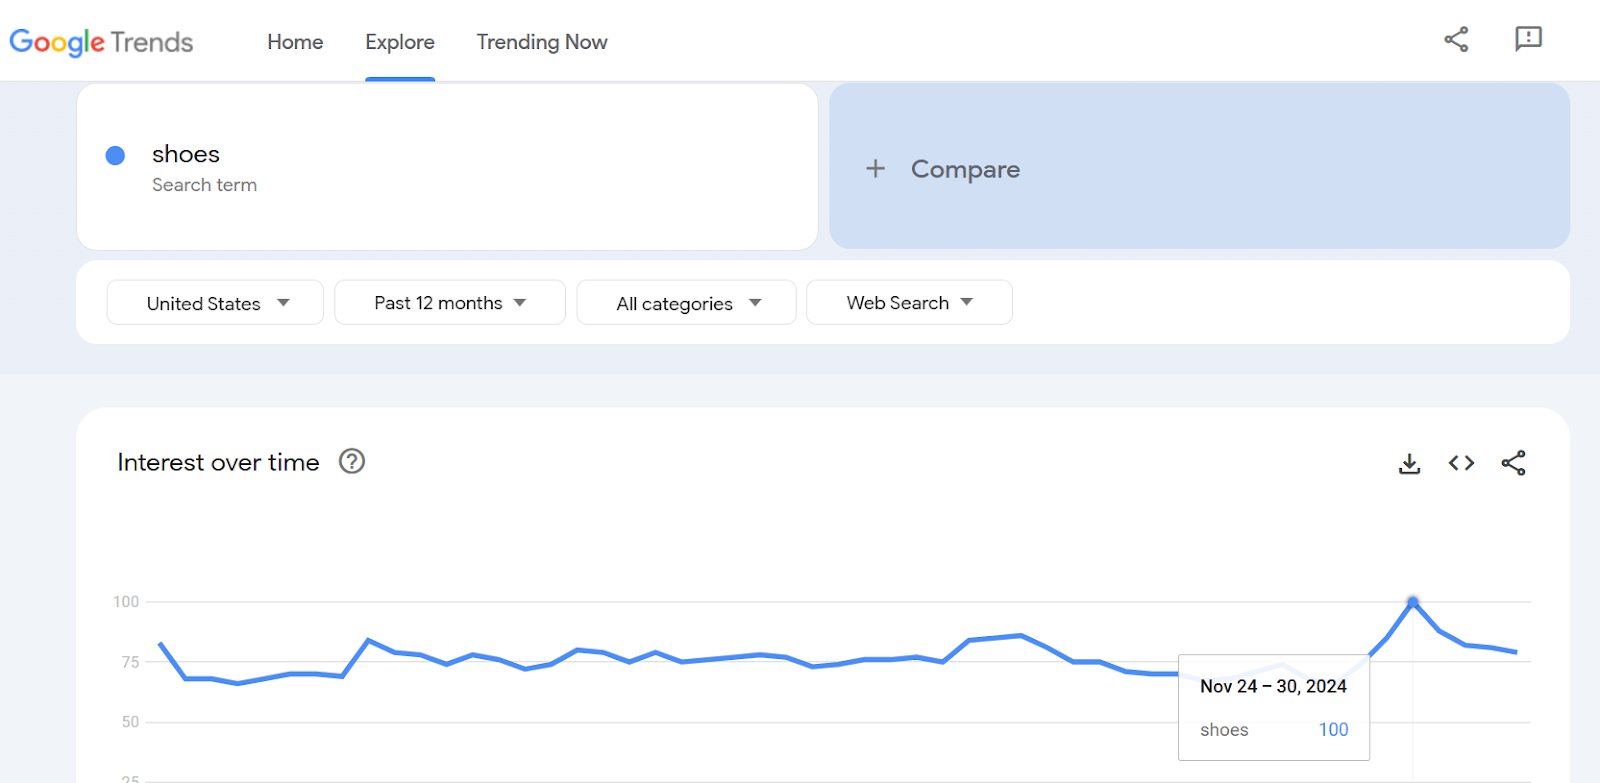
You can even refine data with the given filters to focus on specific regions and watch how a keyword’s popularity changes over time.
You can also set a custom time frame—like the past week or the last year—to zoom in on patterns and spot trends that really matter.
But Google Trends is not like your regular SEO tools. It’s also important to understand what Google Trends is NOT.
Remember, Google Trends Data Is NOT the Actual Search Volume!
When I started researching Google Trends, I realized a lot of people misunderstand how it works.
There is a common misconception that the trend graph represents a keyword’s search volume.
You’d think the trends graph shows results like what you’d see in Google Keyword Planner.
But that’s not how Google Trends works.
Here’s the key difference:

↳ Google Keyword Planner shows the average search volume of a keyword for a certain period of time.
↳ Google Trends shows relative popularity (how often a term is searched compared to other searches).
Google Trends also filters out repeated searches from the same user to give a clearer picture. And if a term isn’t popular enough, it might show as 0.
How Google Trends Calculates Data
Google Trends doesn’t just show raw numbers. Instead, it adjusts the data to make comparisons easier:
→ Each data point is divided by the total searches for that region and time range.
→ The results are scaled on a range of 0 to 100.
In simple terms, it’s about showing how popular a query is compared to all other searches—not the exact number of times it’s been searched.
How To Use Google Trends for Keyword Research
Now, I’ll show you how I use Google Trends to do keyword research.
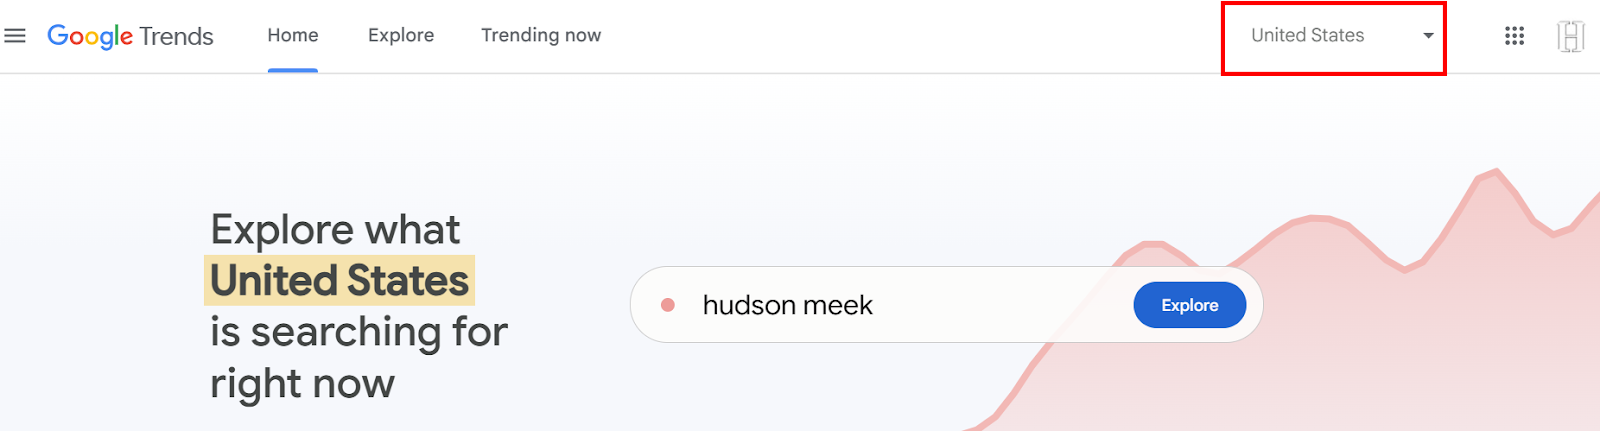
Go to the Google Trends website.
You’ll see a small drop-down menu and your location in the top-right corner, next to your profile icon.
By clicking the drop-down menu, you can select your desired location. You can change it later, too.
I’ve selected the United States.
Type your keyword in the search bar in the middle of the page. I’ll be using coffee shop as an example.
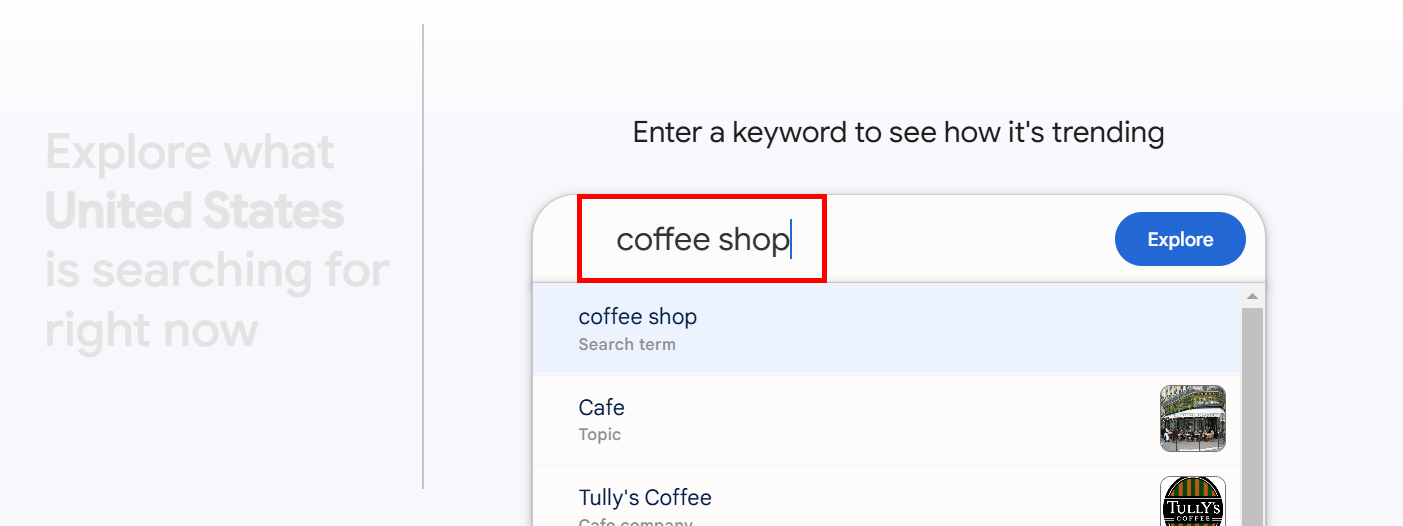
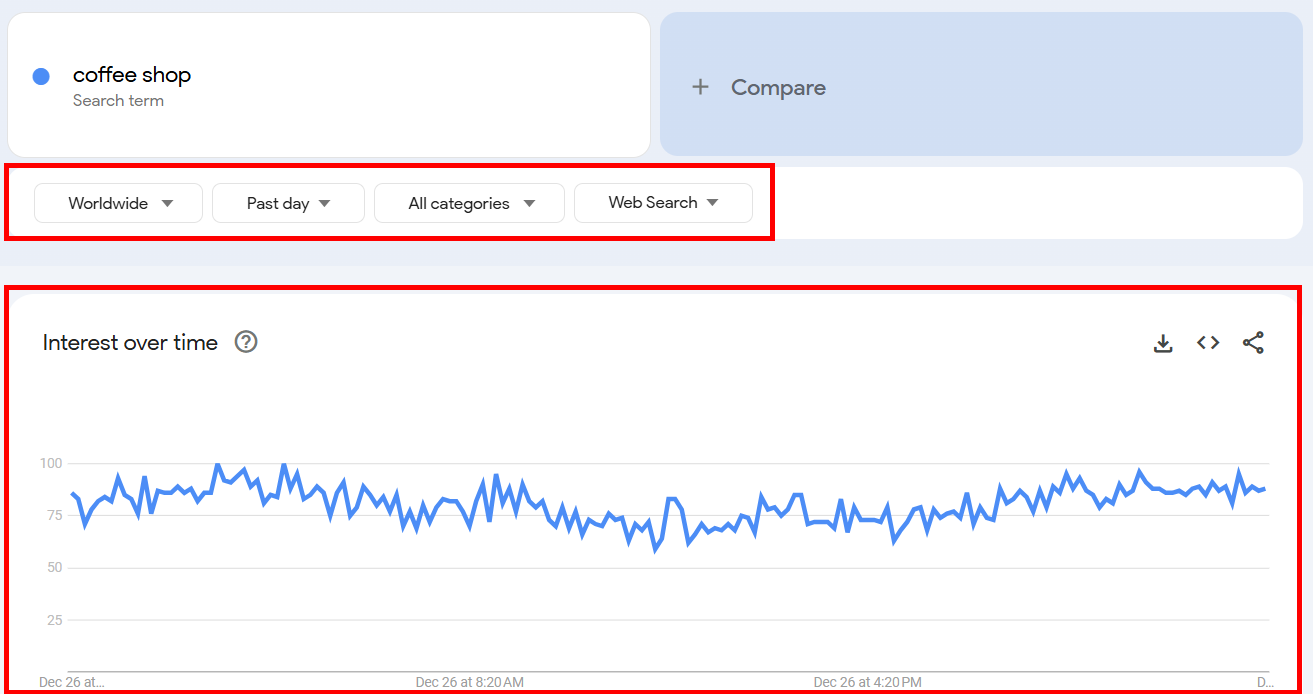
Press Enter or click the blue Explore button and you’ll see a graph like this:
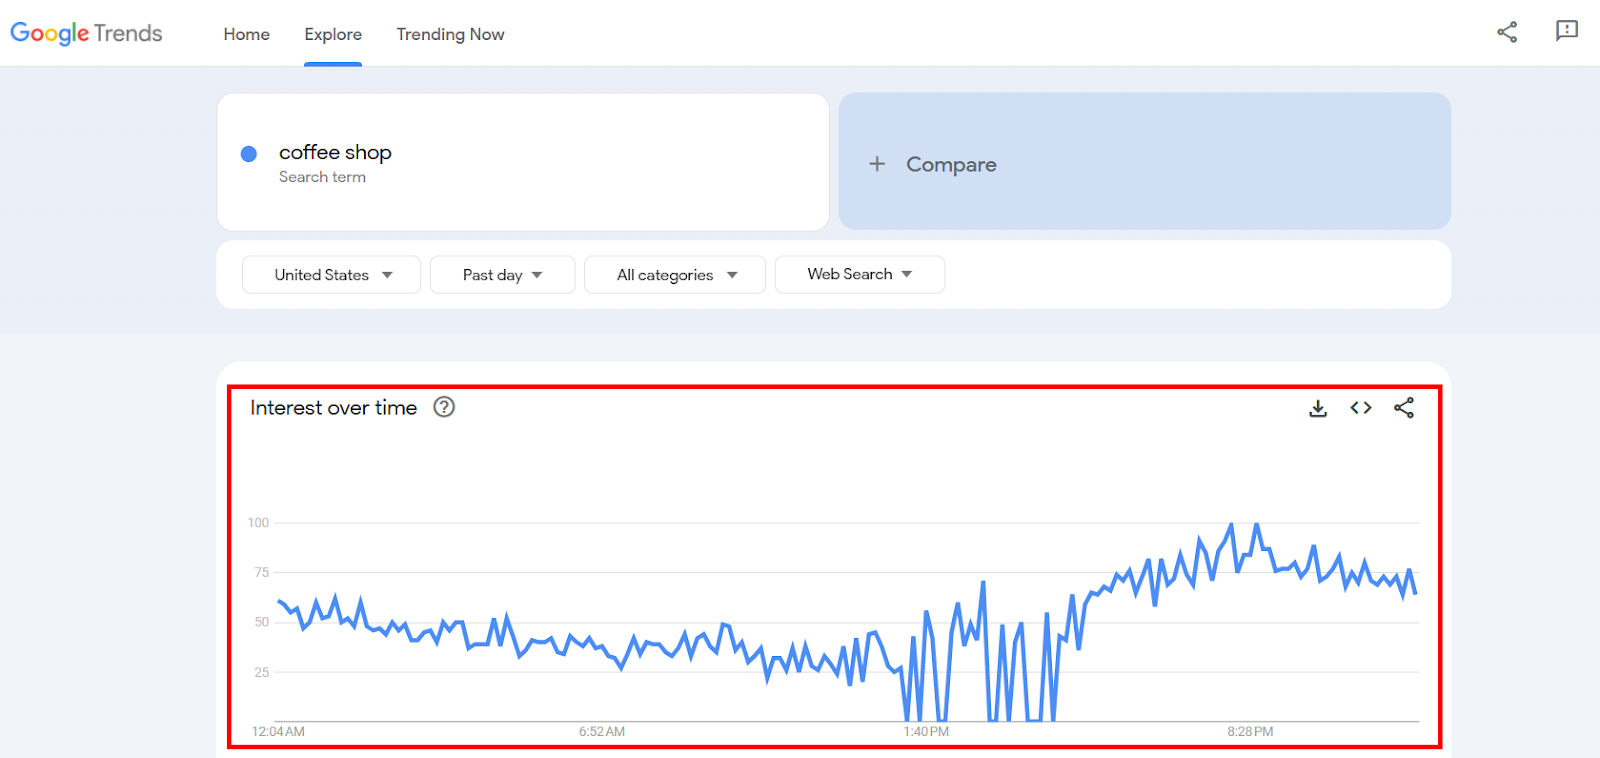
Here, the interest in the keyword coffee shop spiked in the evening time. It may be due to several reasons:
→ Evening Browsing Habits: More people are online after work or school.
→ After-Dinner Cravings: Coffee or dessert seekers might be deciding where to go.
→ Planning the Next Day: People may be searching for spots to visit the next morning.
→ Evening Social Plans: Late-night coffee meet-ups or study sessions could drive searches.
Unfortunately, Google Trends doesn’t explain why a keyword is trending. To understand user intent and create relevant content, you’ll need to use additional tools, like Semrush or Ahrefs.
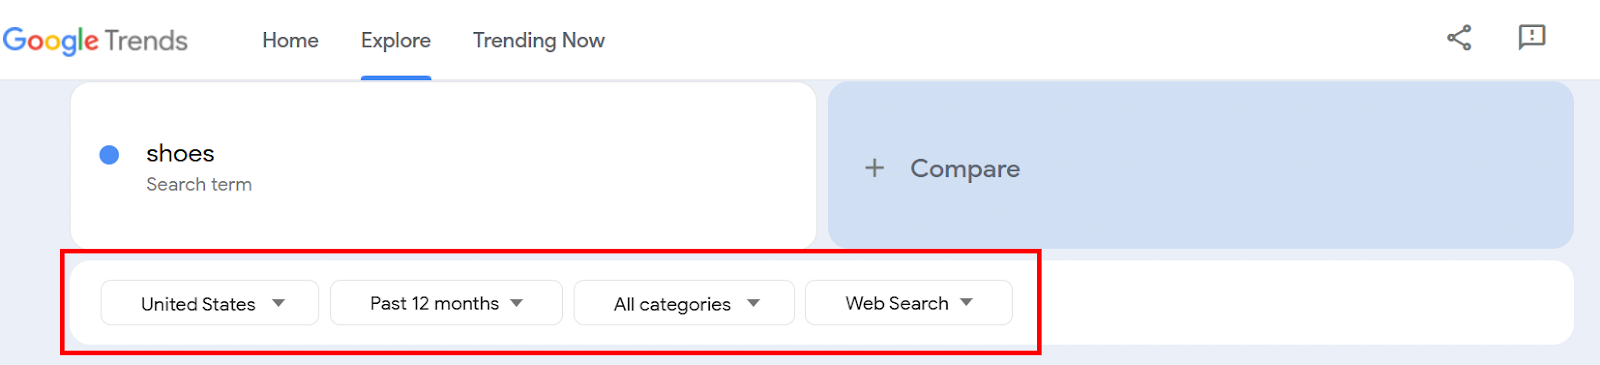
But you can use Google Trends built-in filters to further tweak the results. You’ll see four filters under your search term in the top-left corner.
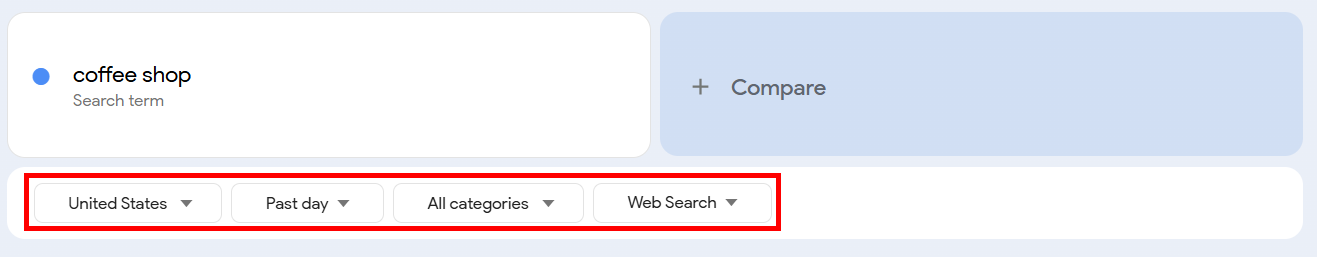
They depict:
- Location
- Time
- Category
- Channel
You can use these filters to find keyword trends more precisely. I’ll show you how.
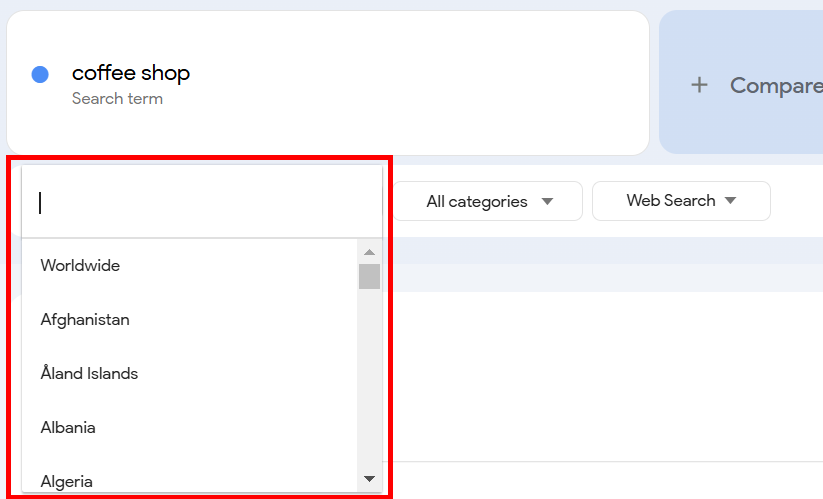
The first filter helps you select a location where your desired keyword is used. If you want to see a broader picture, select Worldwide. But for more localized results, select your desired location, like I picked the United States.
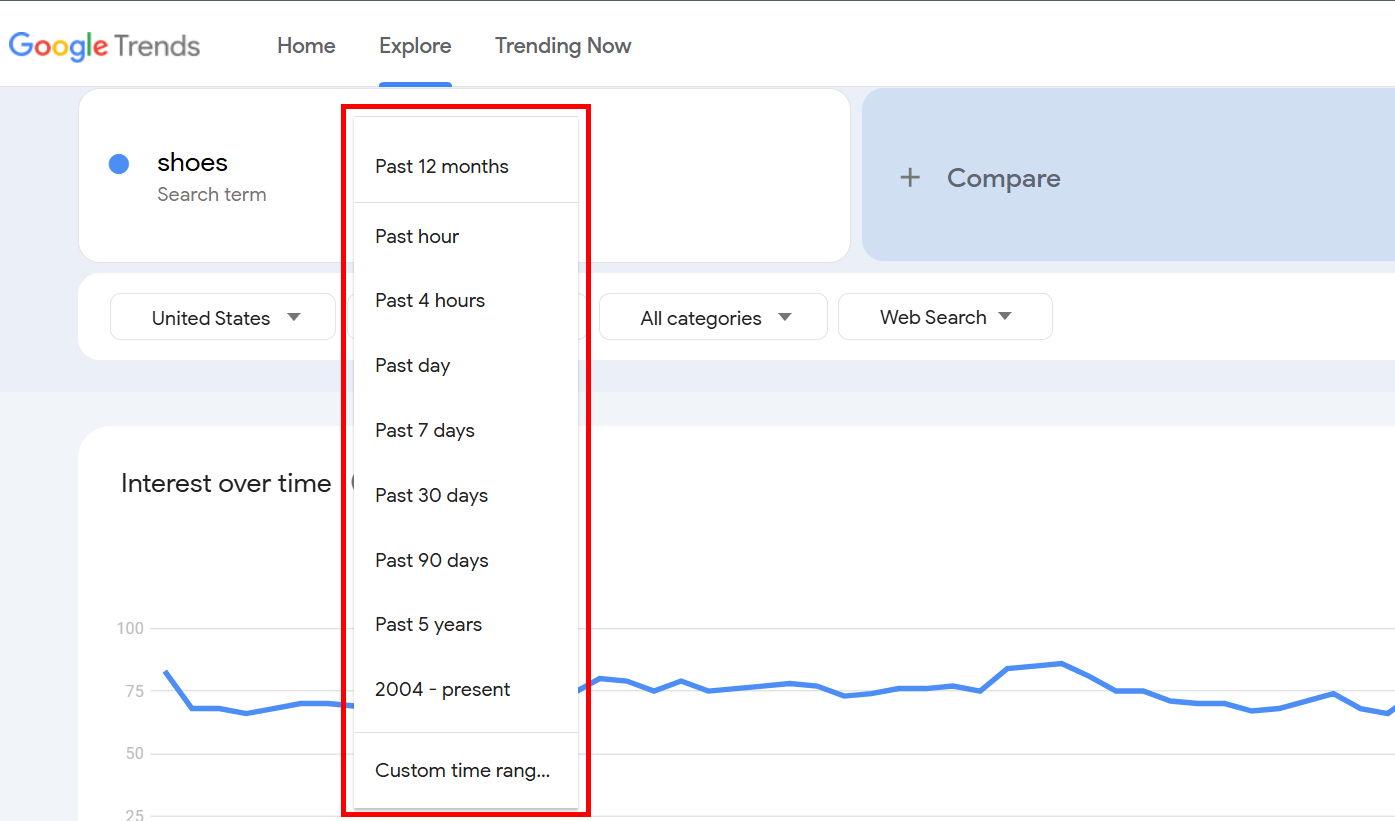
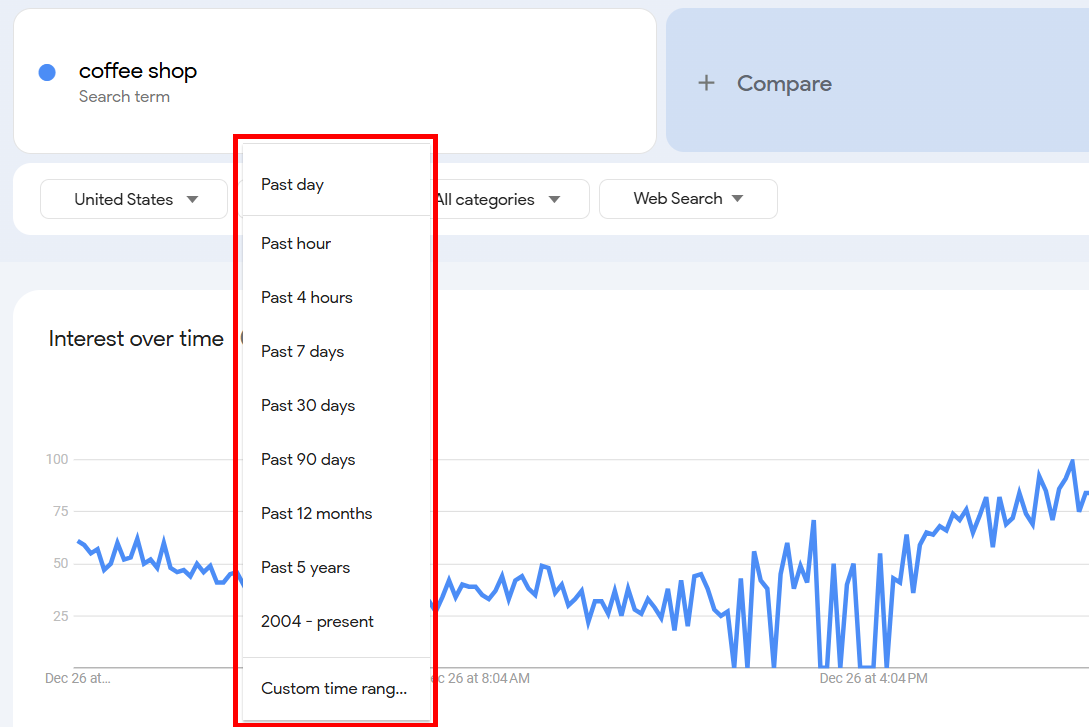
In the second filter, you can set your desired time frame to see the keyword frequency during that time only. You can choose anywhere from the past hour to 2004-Present. You can also set a Custom Range. I selected Past 7 days.
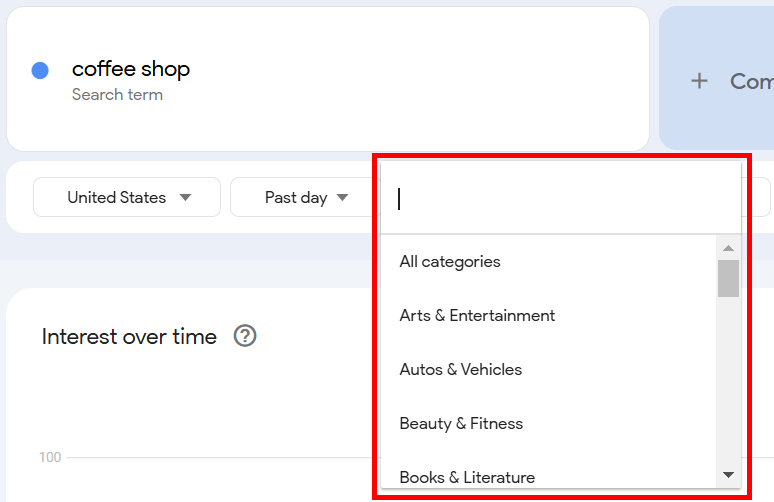
Next, select a Category that resonates with your search query or choose All Categories for broader results. I selected Food & Drink for this one.
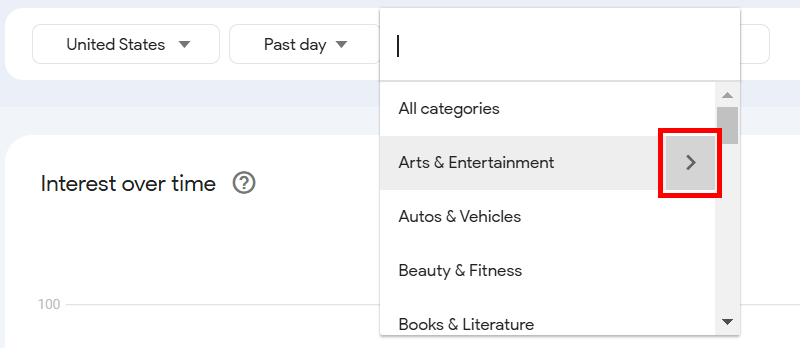
If you hover your mouse over a category, you’ll see a small arrow appear next to it. When you click it, you’ll see sub-categories under each main category.
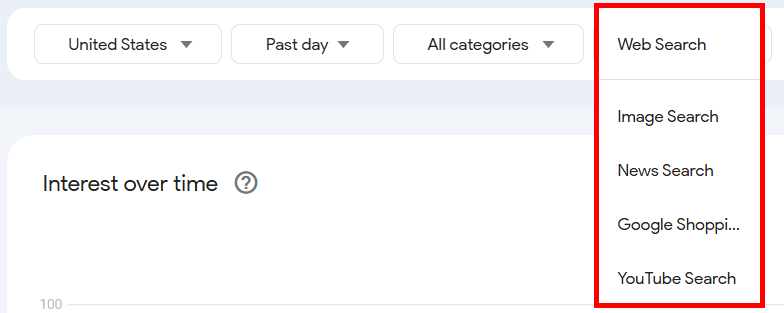
Lastly, select a Channel for which you want to see the keyword frequency. I selected YouTube Search.
Remember, your graph will alter every time you apply a filter. The results are different for different selections.
For example, here’s how my graph for coffee shop looked when I had selected:
→ Worldwide
→ Past day
→ All categories
→ Web Search
But when I picked:
→ United States
→ Past 7 days
→ Food & Drink
→ YouTube Search
..the graph changed to this:
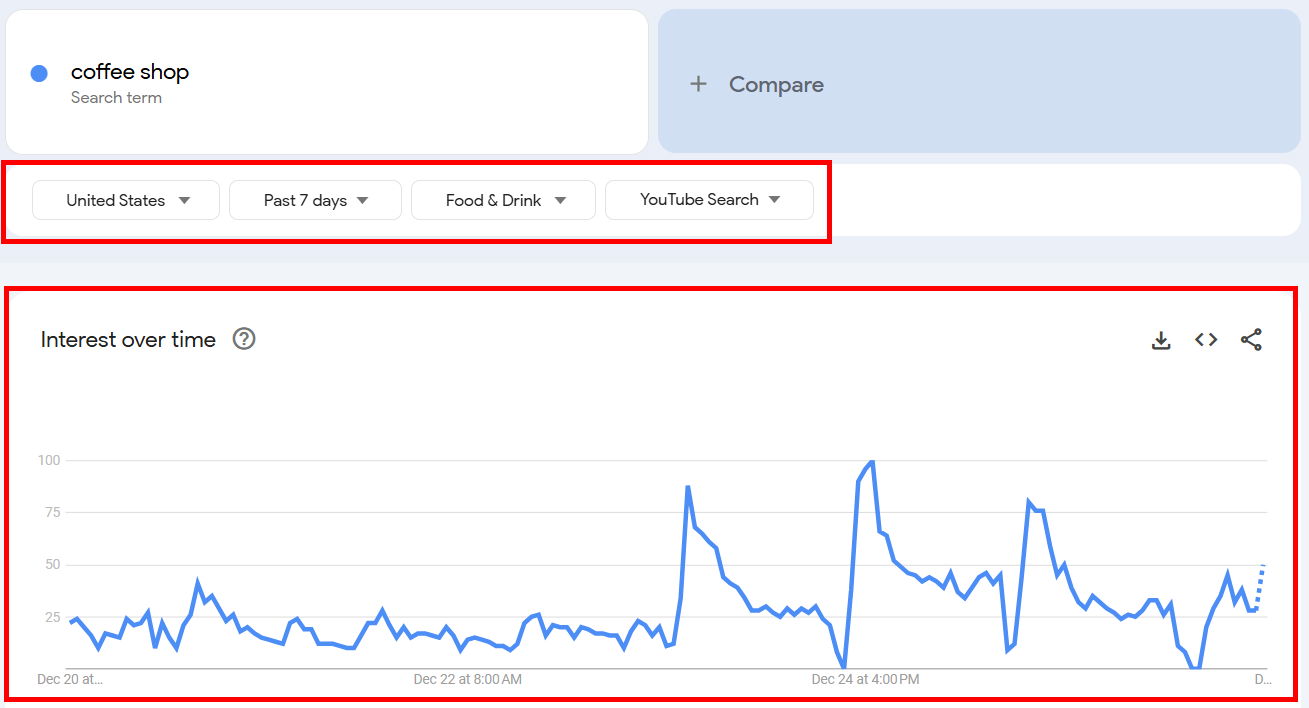
So, you should expect changes like these with every tweak you make to your selection.
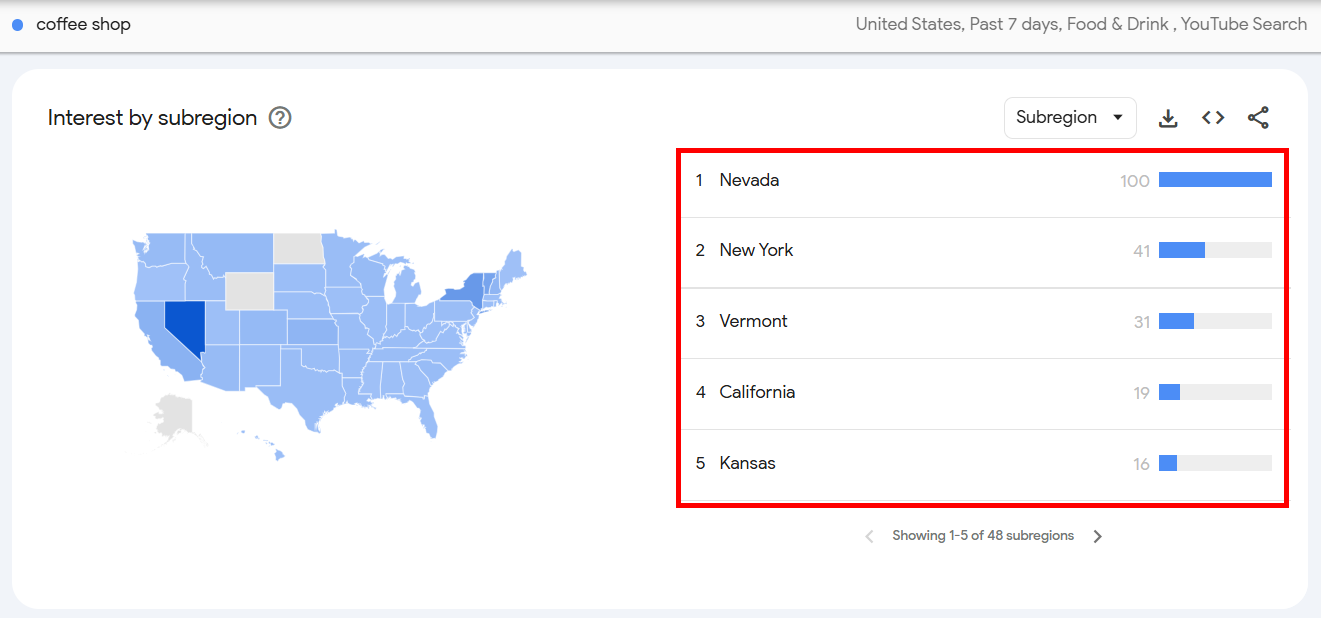
Next, scroll down to the “interest by subregion” section. Here, you’ll see a list of countries where your keyword is performing well.
You’ll see a score from 0 to 100, depending on how popular the keyword is. A 100 score means the keyword is the most popular in that location.
For example, my coffee shop keyword had a 100 score in Nevada and it dropped to 16 in Kansas. (I guess the Grasshoppers know where the best coffee is at).
When you click the Subregion dropdown in the top-right of the interest by subregion section, you’ll get two options:
- Subregion
- Metro
- City
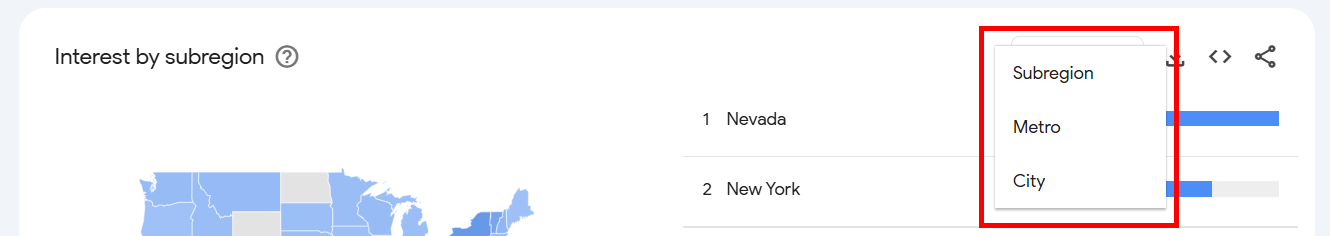
You can select Metro or City to get a metro or city-wise report. Each location will show you a unique set of data from Google Trends.
Now, scroll down further to the Related topics and Related queries section.
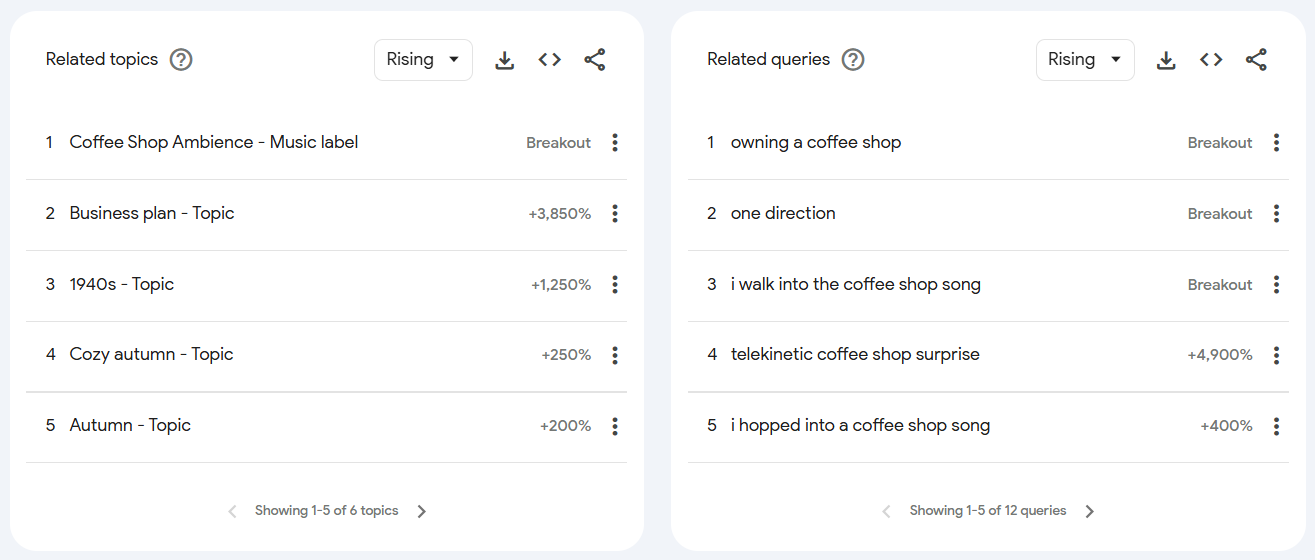
This is where you’ll get keyword and query suggestions based on your keyword.
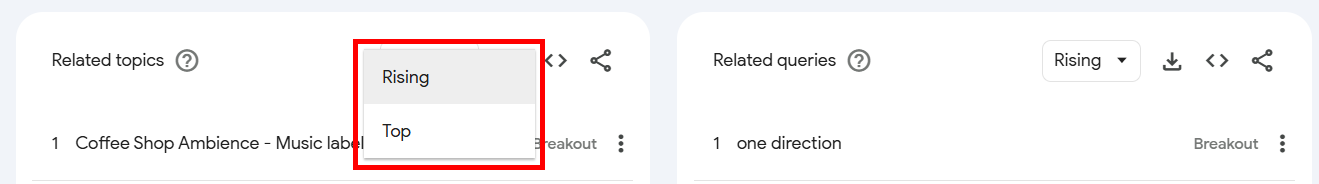
Click the Rising tab next to Related topic or Related queries and select Top.
Similar to the Region report, this shows the top topics and queries. You’ll see a list of trending keywords for the chosen timeframe.
When I selected Top, I got the following results:
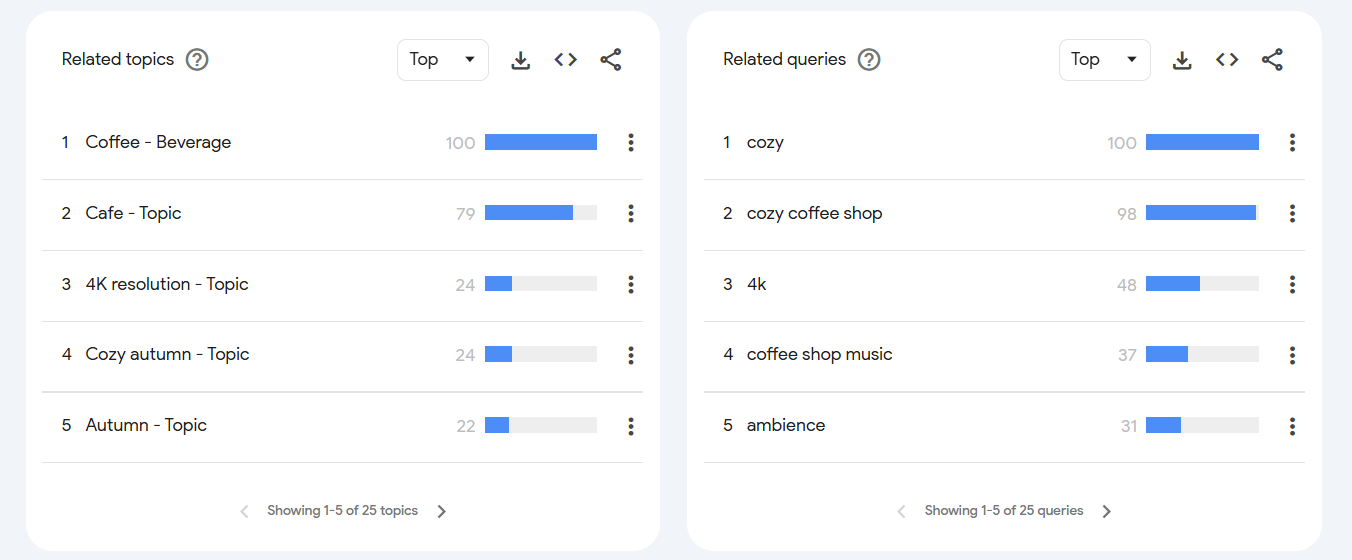
These made more sense for my keyword research than what I got on the Rising option.
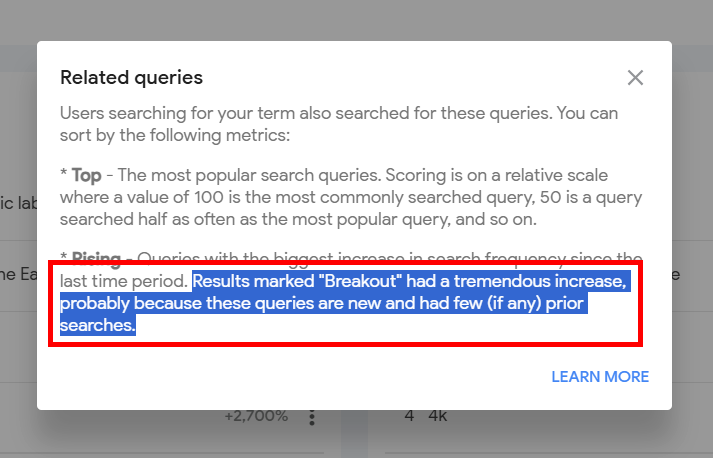
If you see the word Breakout written next to a query instead of a % growth, it’s a good thing. (More on that in the next sections).
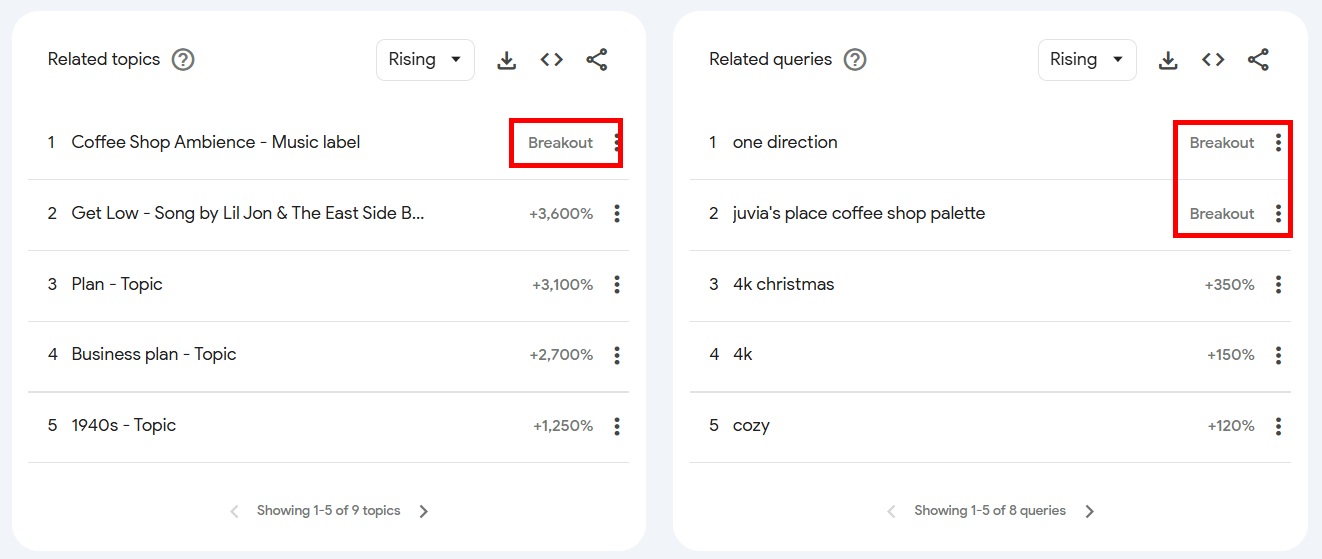
Google uses the term “breakout” when there is insufficient search data to calculate a meaningful percentage change. As per Google, if a search term grows tremendously, they label it as “breakout” instead of showing the exact percentage increase.
Another handy feature of Google Trends is the option to compare multiple terms.
Simply click the Compare button at the top and add additional keywords.
For example, I added cafe to compare it with coffee shop. Google Trends compared the search interest for both and showed me these results:
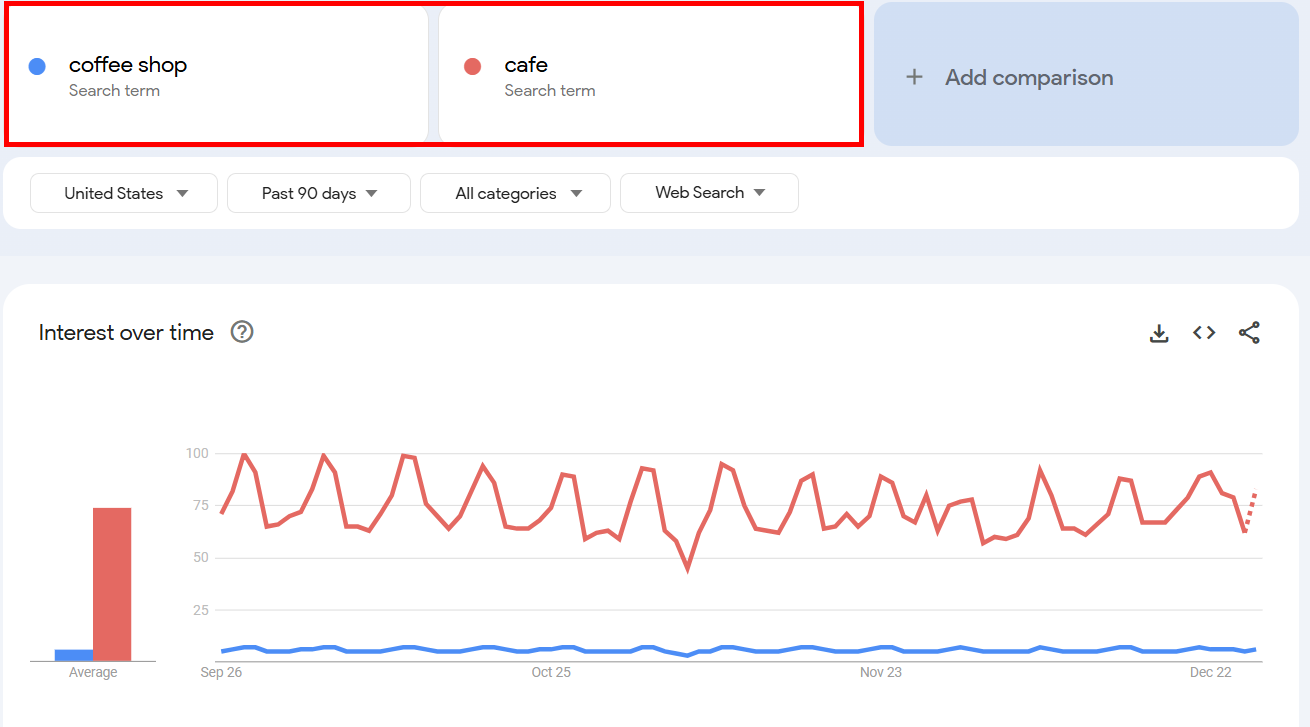
In my case, cafe was clearly leading in terms of popularity.
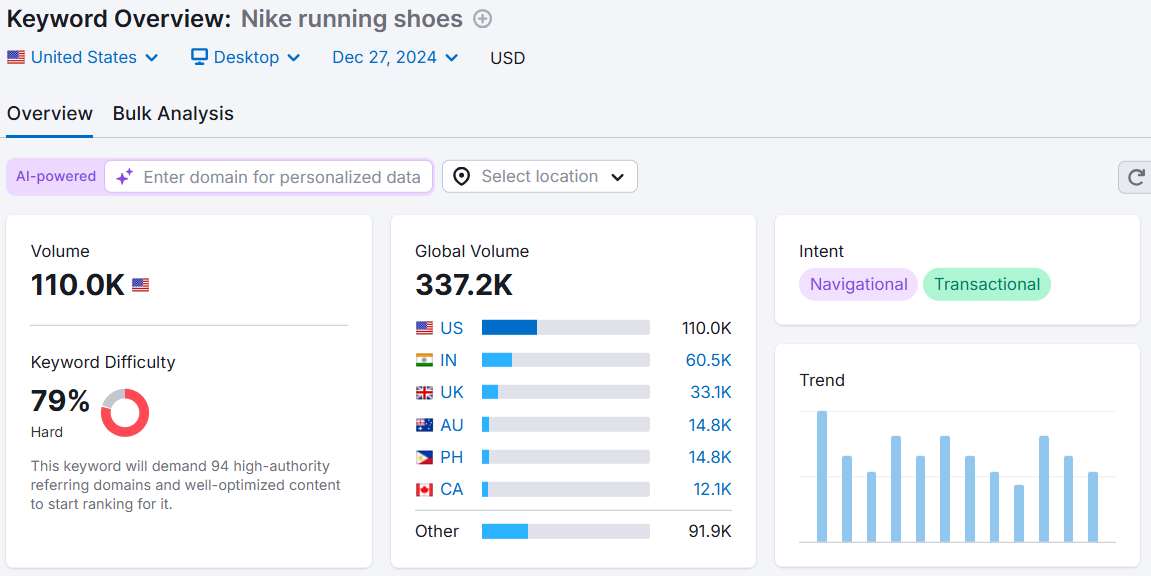
The downside? Google Trends doesn’t show exact search volume or keyword difficulty—both of which are important from an SEO standpoint.
That’s why I pair Google Trends with Semrush’s Keyword Overview tool. I just plug in my keywords, hit Search, and get metrics like volume and keyword difficulty to help me make smarter decisions about my SEO strategy.
Now that you have a list of valuable keywords, how else can you use Google Trends to implement your keyword research?
7 Ways I Use Google Trends to Guide My SEO (After Keyword Research)
\Knowing what to do after keyword research is important to make the best of your keywords and implement them optimally. Here’s how you can do that:
1. Create Topic Clusters
You can use Google Trends for SEO in a more strategic way: by building topic clusters.
Topic clusters organize your site content around main themes, with related subtopics connected to a central pillar. This structure keeps your content organized and improves internal linking, which is crucial for SEO.
I’ll use the shoe example once again.
Suppose you have an online shoe store and your main pillar topic is best running shoes.
Go to Google Trends, search for best running shoes, and check out the Related topics and Related queries sections.
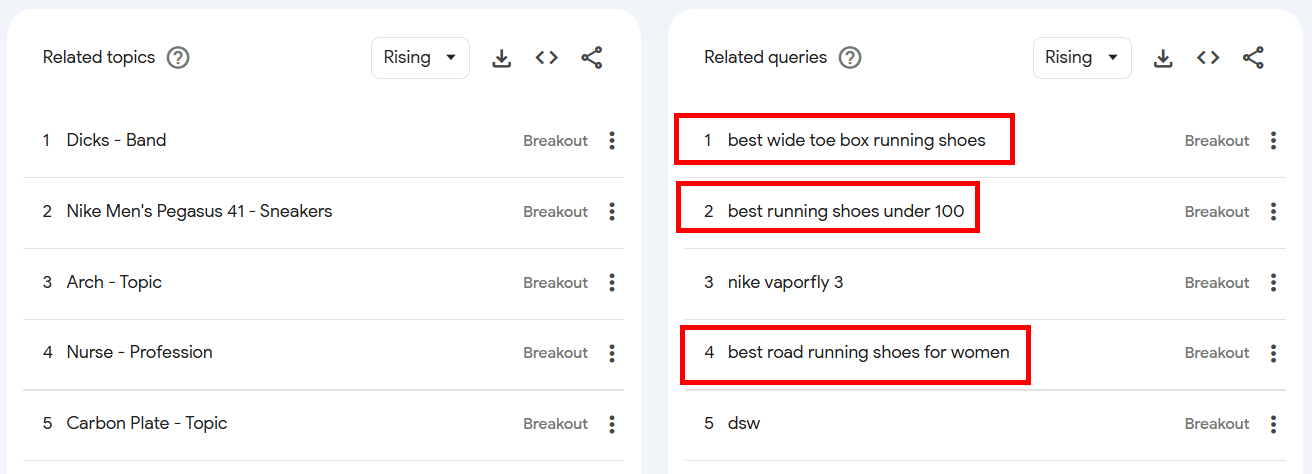
Some subtopics you might want to consider:
→ best road running shoes for women
→ best wide toe box running shoes
→ best running shoes under 100
These could inspire blog post ideas that attract your audience.
2. Discover Video Topics With YouTube Search Trends
Most people use Google Trends to find popular keywords for Google searches, but did you know it’s also great for YouTube keyword research?
YouTube SEO is all about getting your videos to rank higher in YouTube’s search results and gaining more visibility across the platform.
The first step is finding topics your audience cares about so you can create videos they’ll love. That’s where Google Trends comes in handy!
Suppose your channel focuses on footwear. Enter a topic idea like running shoes into Google Trends.
Next, apply these filters:
→ Change the default “Web Search” category to YouTube Search.
→ Select the All categories drop-down and set it to match your theme, like Shopping.
Now you can view the overall trend of running shoes on YouTube.
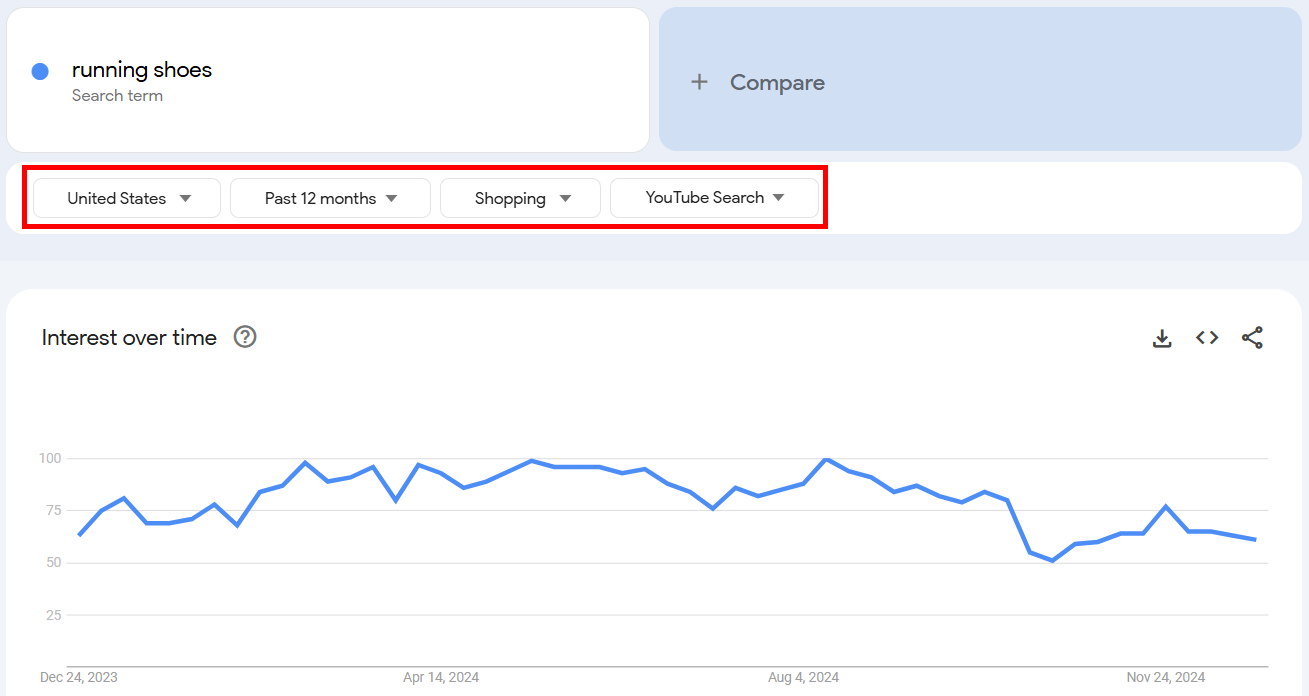
If the trend is stable or growing, it’s a good topic for video content.
There’s another neat trick I found for finding related video ideas for YouTube.
Just scroll down to the Related topics and Related queries sections and you might find ideas like:
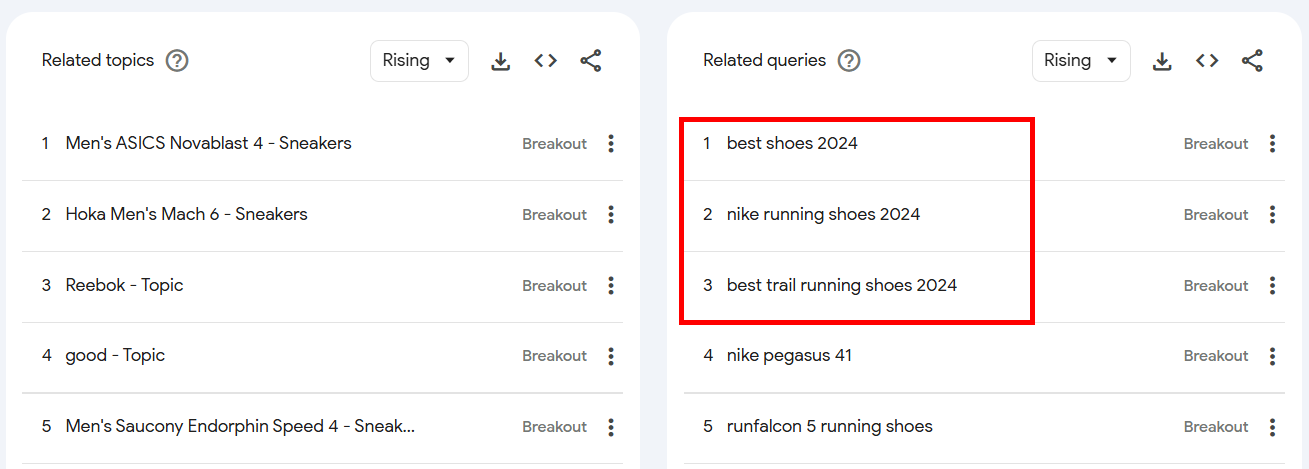
You can create videos on these topics for your YouTube channel, showcasing some of your bestselling footwear.
3. Optimize Your Local/International SEO
To generate more qualified leads, don’t ignore location-based searches. Focus on the areas where you want to boost sales for your products or services.
Whenever I’m researching for a local/international business, I always use the Interest by subregion feature in Google Trends. It shows where a keyword is trending in different states, cities, and areas.
Suppose you sell running shoes and want to know which U.S. states are most interested in them.
Start by entering running shoes into Google Trends and check the Interest by subregion section.
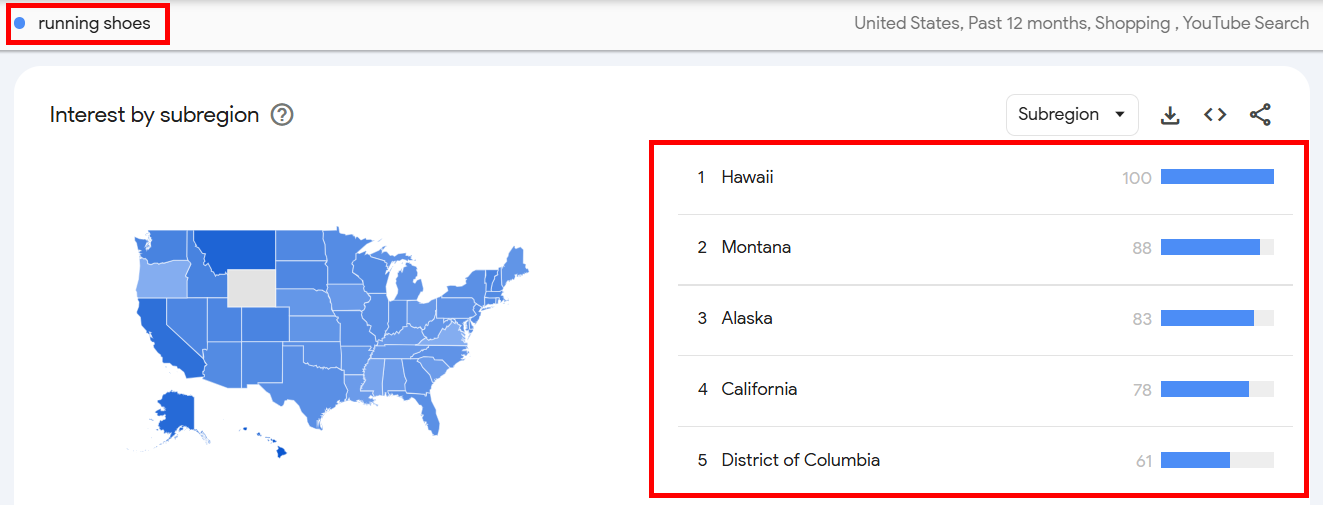
You’ll discover which areas have the most interest.
In my case, the Google Trends results for running shoes showed high interest in states like:
→ The District of Columbia
→ California
→ Montana
→ Hawaii
→ Alaska
This could be because Hawaii, Montana, and Alaska have active outdoor lifestyles, while California and D.C. are fitness hubs, driving searches for running shoes.
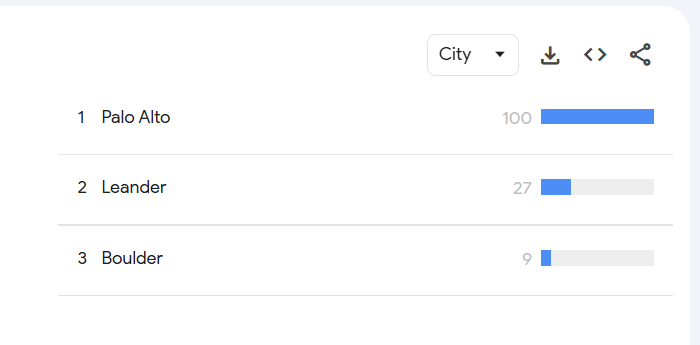
If you want city-level data, select the City option from the Subregion dropdown.
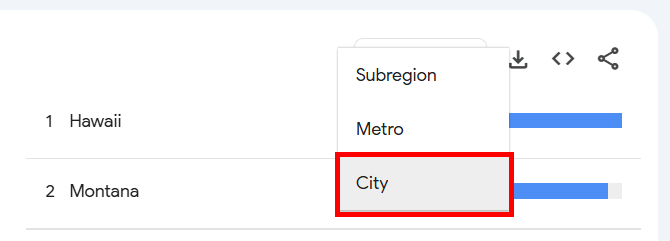
Here’s what I got:
Now that you have this data, here’s what you can do with it:
↳ Target specific regions with ads: Instead of running ads across the entire U.S., focus on cities or regions where searches for running shoes are highest. For example, I would run ads in Hawaii and Montana for my shoe shop.
↳ Create location-focused content: Write articles like Best Running Trails in Montana and the Shoes You Need to engage customers in these areas.
Another cool thing you can do with Google Trends is compare how interest in a search query varies across locations—a handy feature I only recently discovered!
Type the same search term in the Compare box. In my case, it’s running shoes.
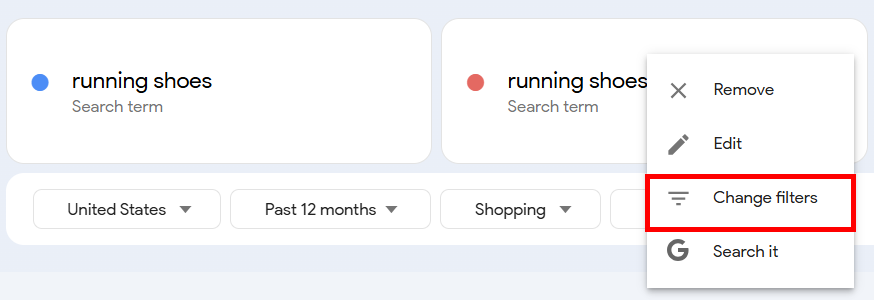
Click the three vertical dots icon next to a search term.
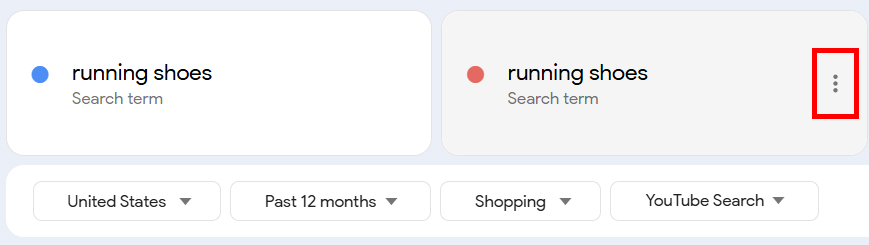
Select Change filters from the menu and apply relevant filters to compare interest across regions.
For example, I compared interest in running shoes in Hawaii and Montana and got these results:
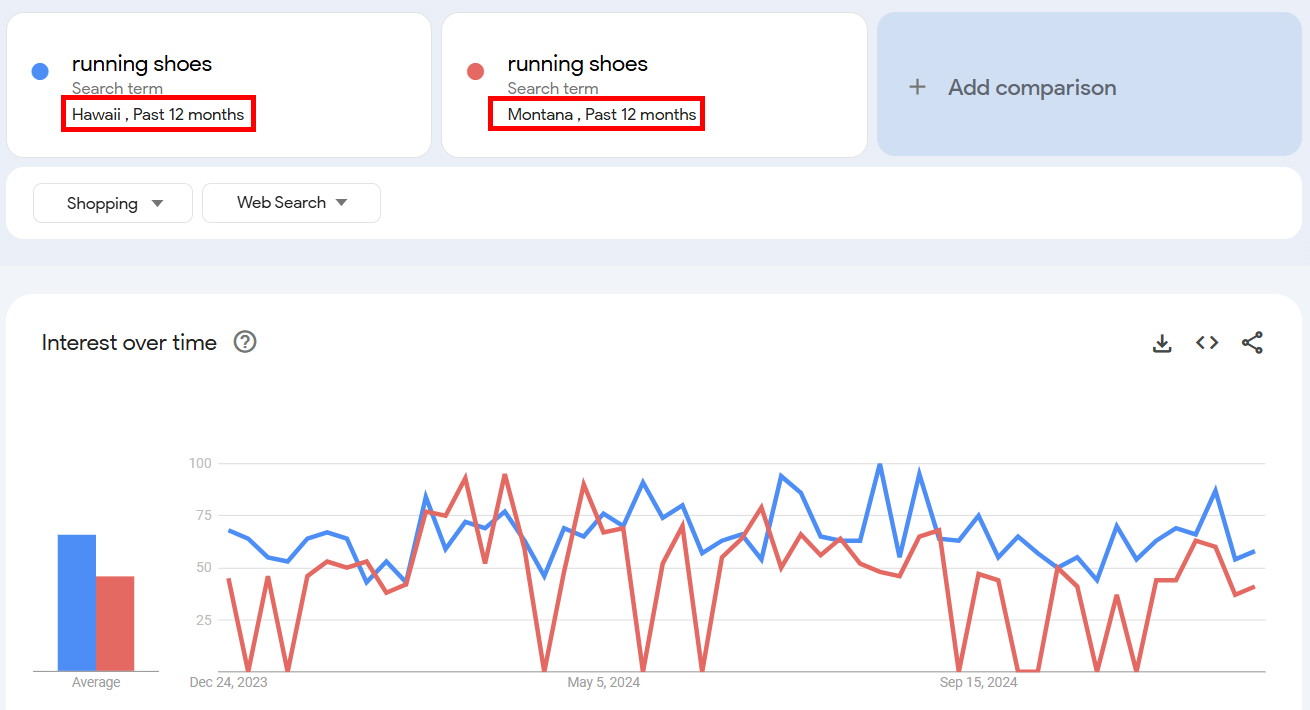
Even if Hawaii has more searches overall, similar trends in both states show running shoes are just as popular relative to the population.
4. Find Seasonal Trending Topics | Or Check A Topic’s Seasonality
A smart marketing strategy taps into seasonal trends (like holidays or specific times of the year) to increase sales and traffic.
If you sell running shoes, you might notice a spike in interest before marathon season or during New Year’s resolutions when people focus on fitness goals.
You can validate this with Google Trends:
The interest over time graph for running shoes may show increased searches in early January or spring as marathons approach.
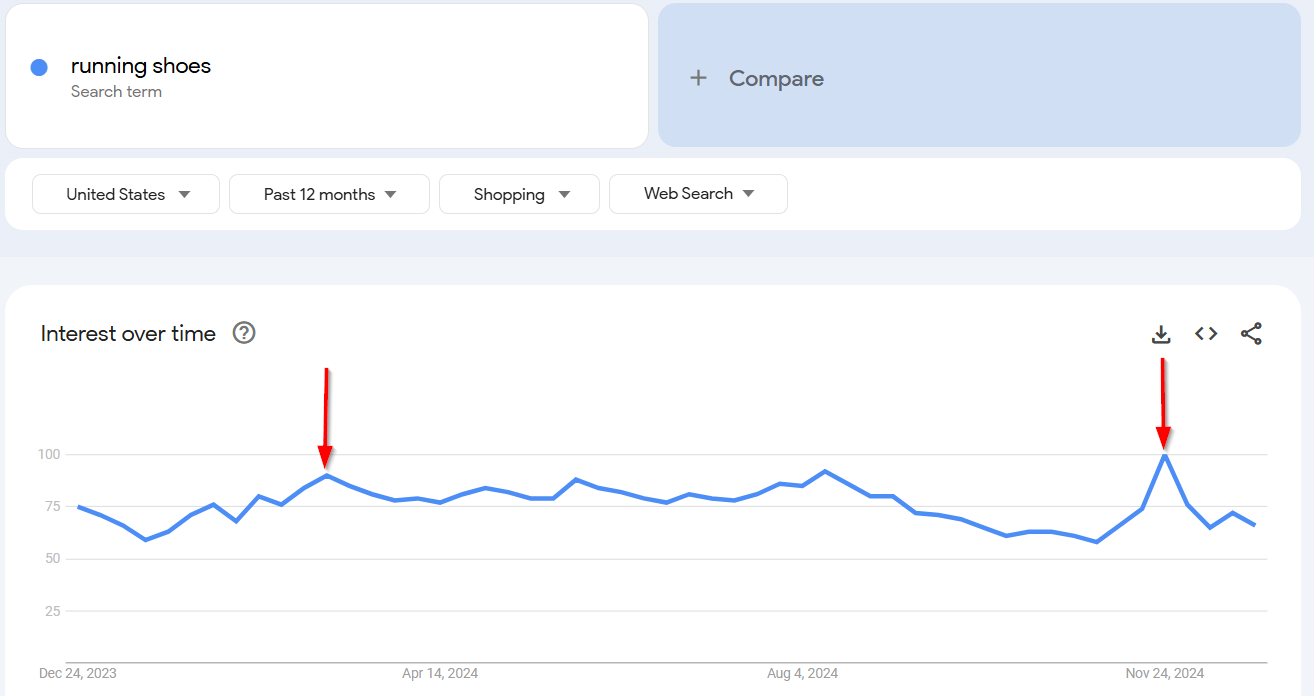
When I searched for running shoes, I noticed two spikes:
→ March: Likely due to the spring marathon season.
→ November: Possibly from people buying gifts for Christmas.
Once you spot a trend, you can adjust your marketing efforts by:
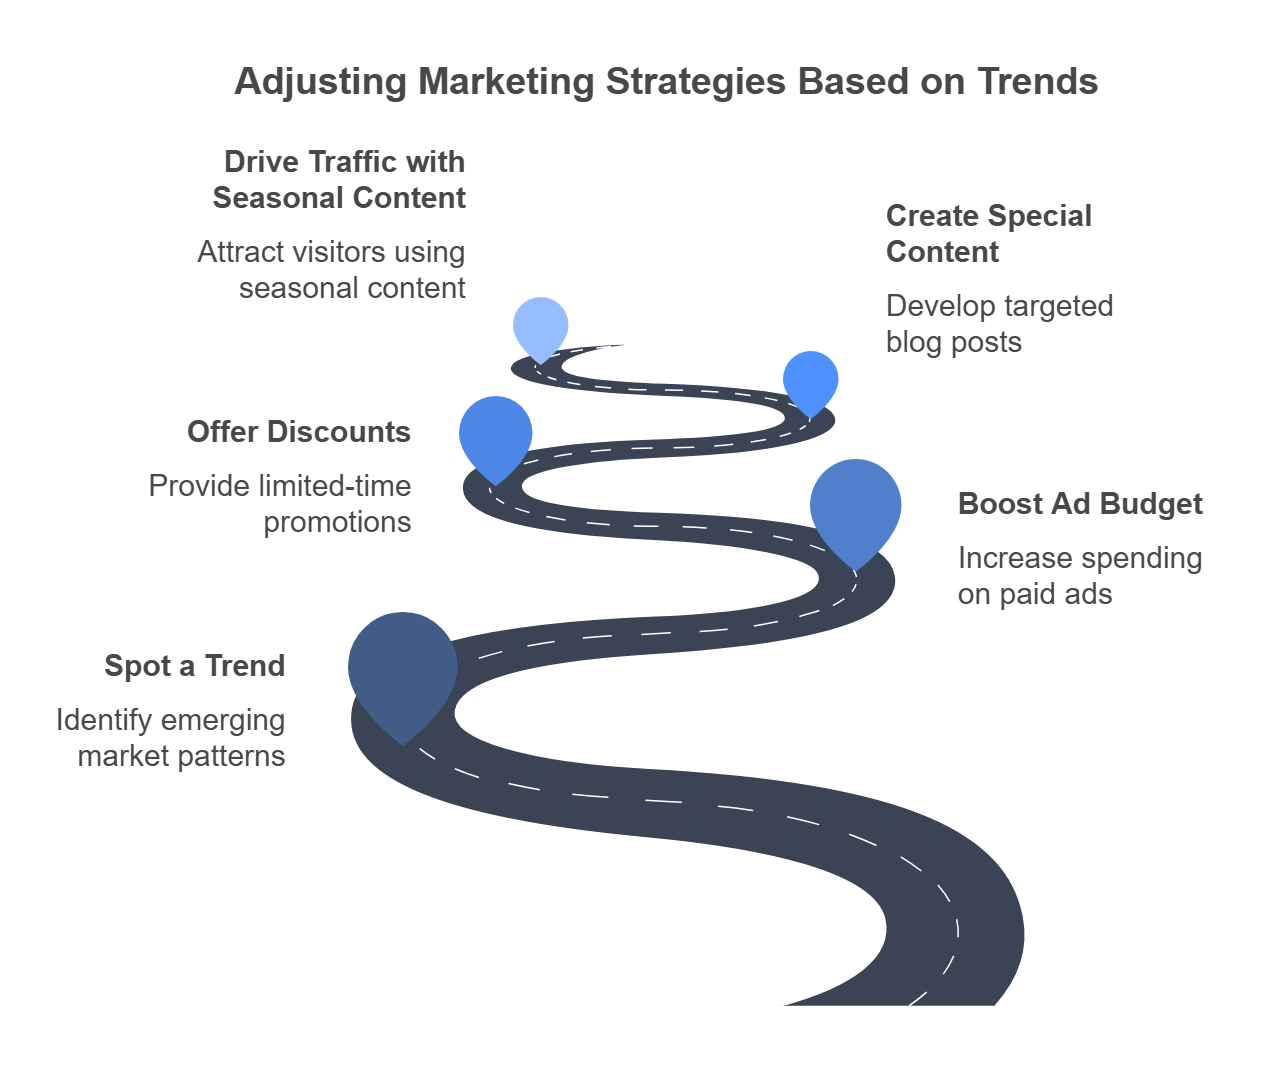
↳ Offering limited-time discounts or promotions.
↳ Increasing your paid ad budget during these periods.
↳ Creating special content, like a blog post on “How to Choose the Best Running Shoes for Marathon Training.”
Seasonal content like this can drive traffic year after year with minimal updates.
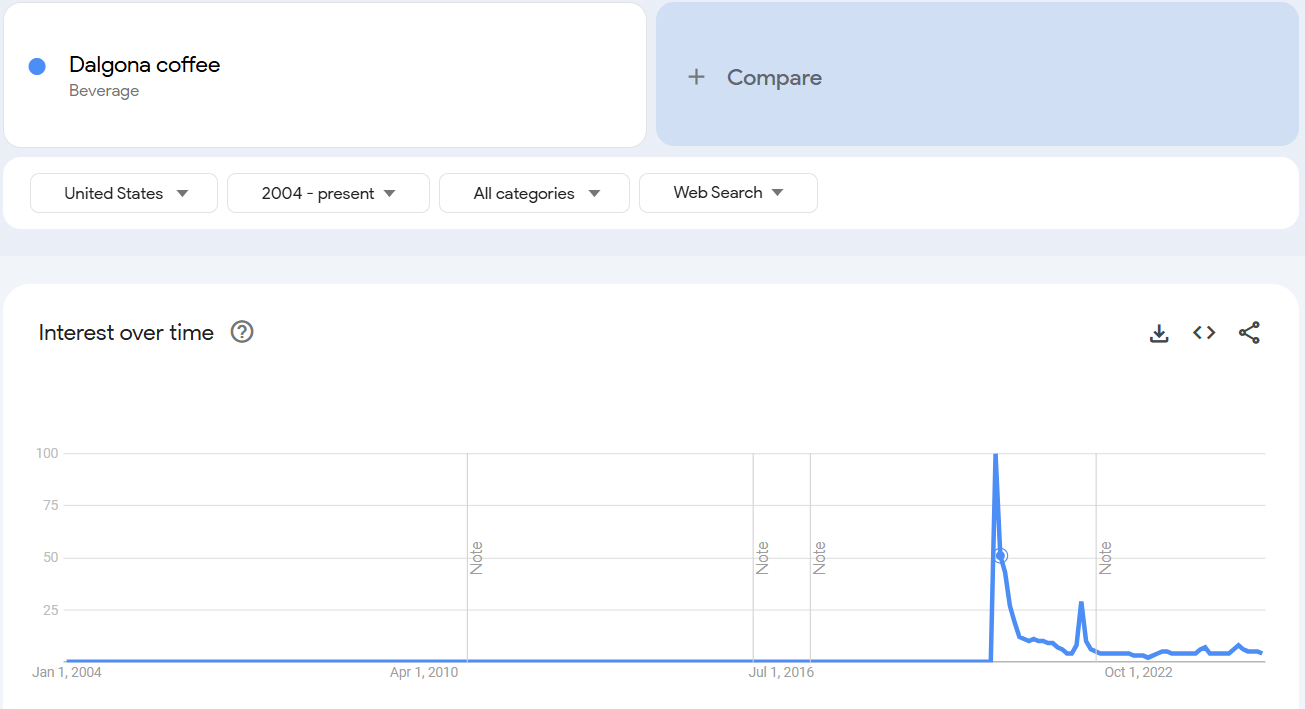
However, make sure to differentiate between recurring trends and short-lived fads.
For example, a trend like hot chocolate recipes spikes every winter, while something like Dalgona coffee was a fad that quickly faded after its peak in 2020.
5. Plan Your Content Calendar
Another thing Google Trends can help you with is planning your content calendar for the year.
Suppose we look up the term Black Friday.
I checked this term over a 5-year period, and saw that the search volume peaks at roughly the same time every year: late November.
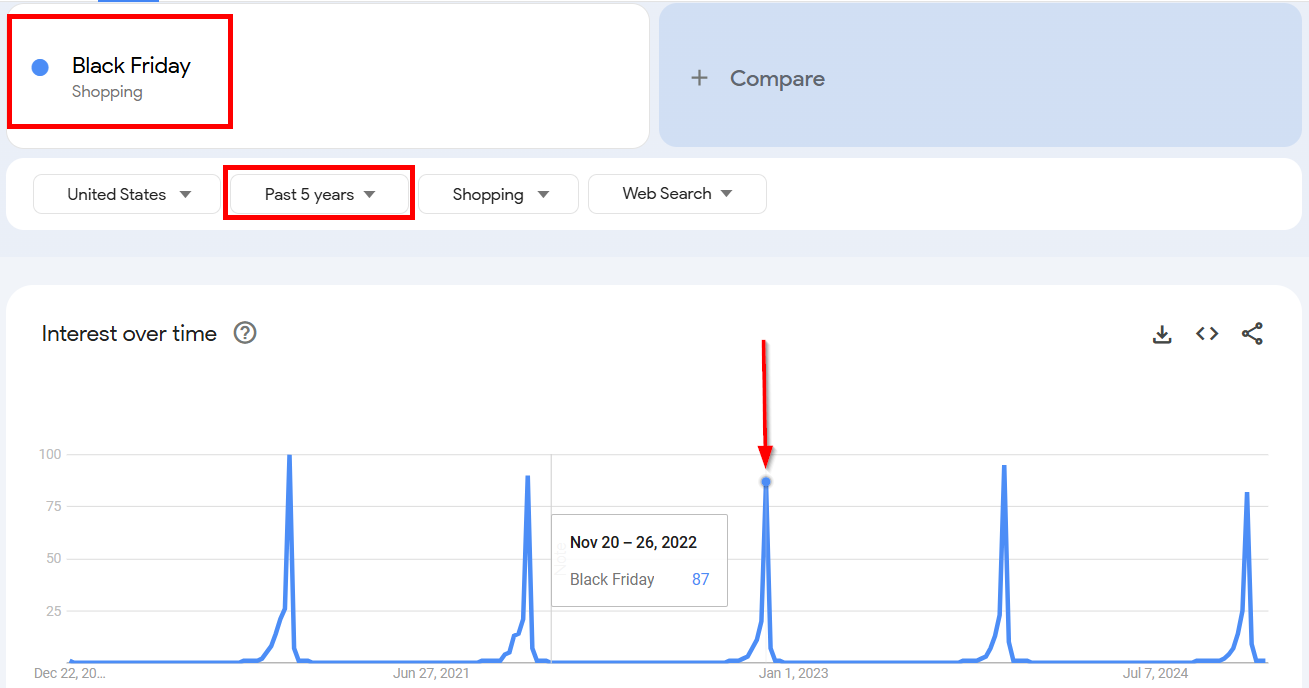
This is because Black Friday always falls on the day after Thanksgiving in the U.S.
So, if you run a website dedicated to e-commerce deals, you should note this trend in your editorial calendar.
Make sure you publish relevant content—like Top Black Friday Deals to Watch Out For—just ahead of this seasonal surge in interest.
Now, let’s look at another term in Google Trends. Type in hot chocolate.
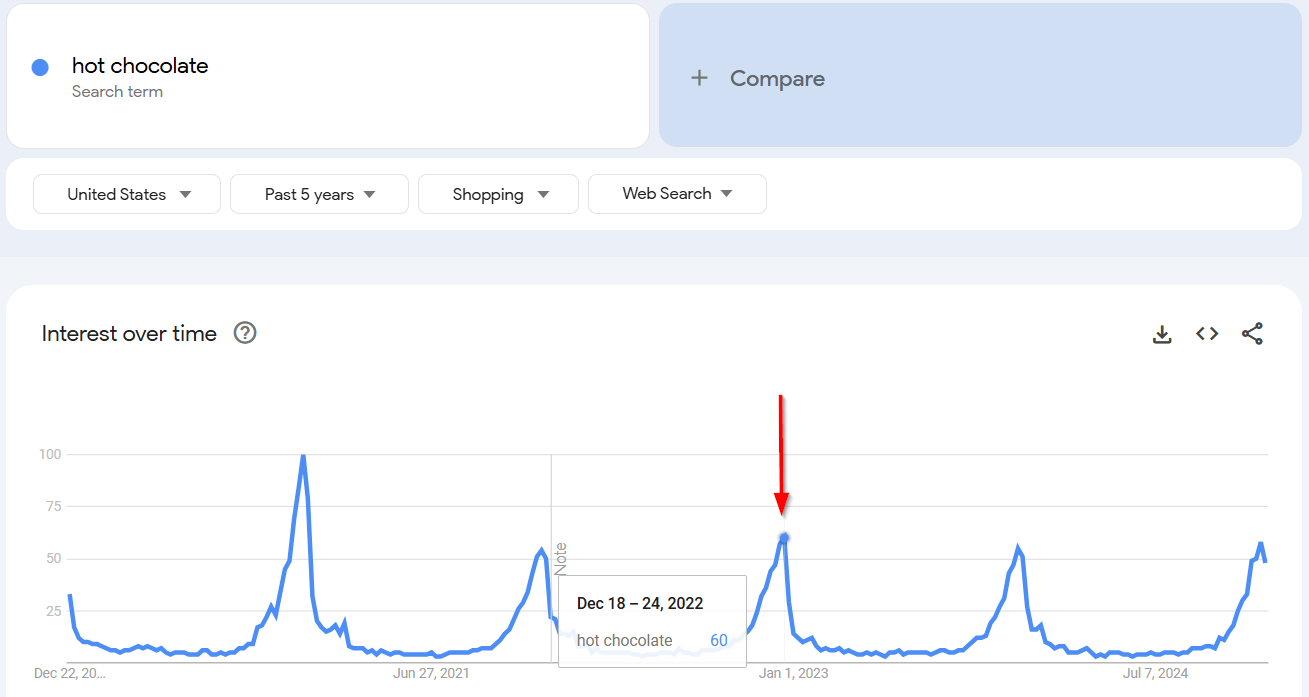
When you check the data, you’ll see a yearly spike in hot chocolate searches during late fall and winter, peaking in December around Christmas.
So, instead of creating a new post each year, it’d be better to publish one evergreen piece, like The Ultimate Hot Chocolate Guide. Then update it annually with fresh recipes, photos, or tips to keep it relevant and maintain good rankings when the chilly weather rolls in.
Here’s another example for you:
Type ugly Christmas sweater into Google Trends.
You’ll spot a big spike in search popularity every year in December—just in time for all those holiday parties.
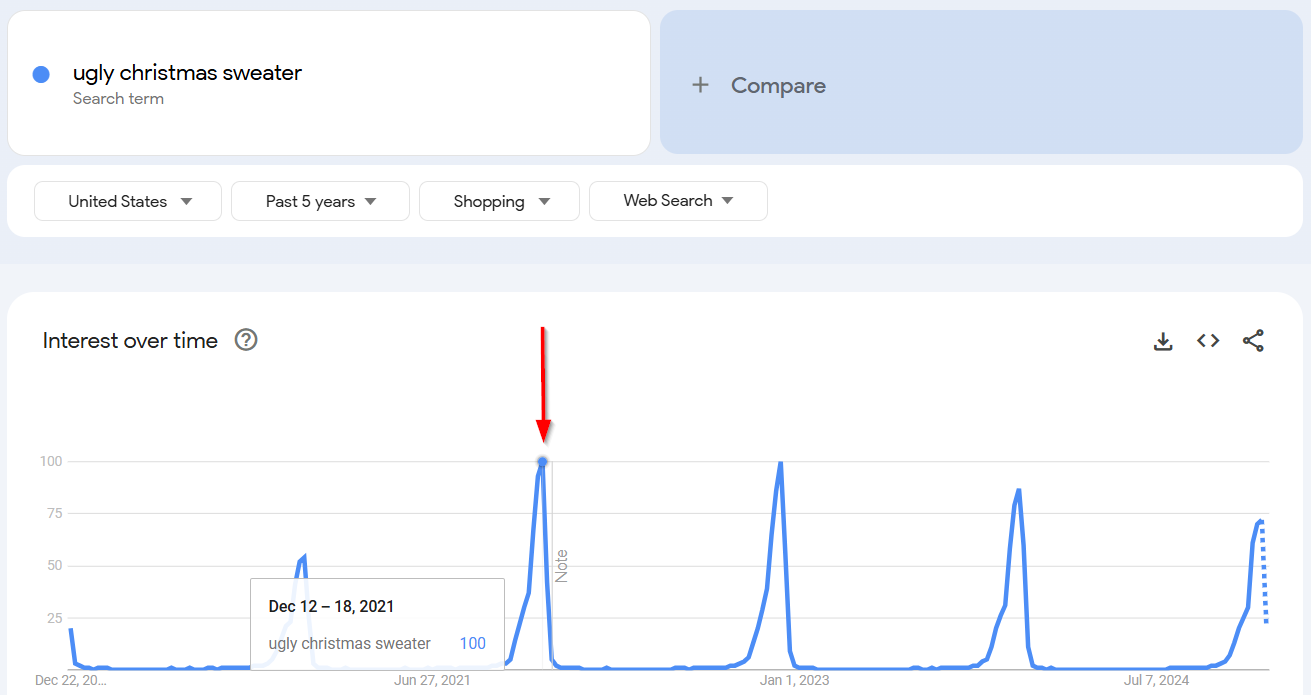
I suggest publishing your Top X Ugly Sweaters for 20XX list every December—or, again, just update your existing post from the previous year with fresh picks. So simple, right?
So, by seeing such trends, you can plan your content calendar accordingly. This way, you’ll create content during its peak popularity period.
6. Keep Tabs on How You Stack Up Against Competitors
Staying aware of how you compare to competing brands is key to improving your own marketing strategy. That’s where competitive benchmarking comes in.
One easy place to start is the Compare feature in Google Trends. It shows how your brand’s search popularity measures up against others over time.
Let’s say you run a growing sports footwear company and want to see how you’re faring against two industry players: Nike and Adidas.
By setting your Google Trends timeframe to the last few years, you’ll get a bigger-picture view of each brand’s momentum.
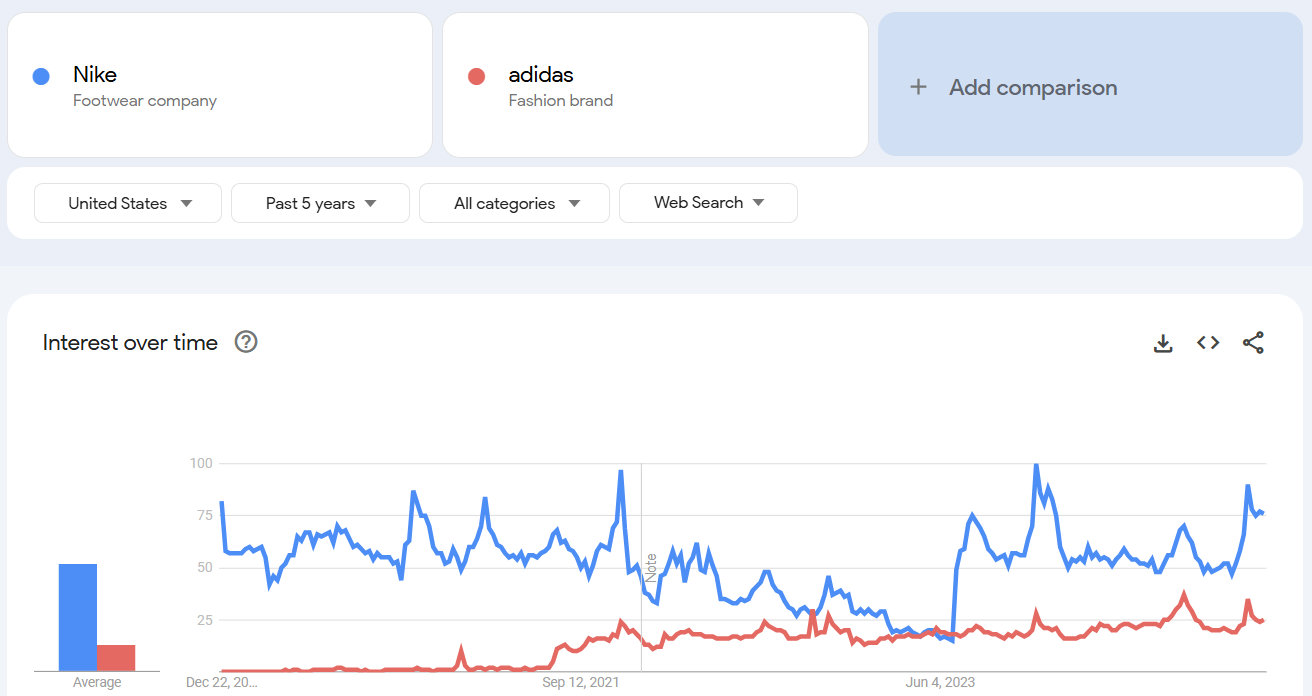
When I compared the two terms on Google Trends, I saw that Adidas’s interest stays fairly steady, while Nike has noticeable dips and spikes, possibly during product launches or promotions.
I also spotted increased search volume around the holiday shopping season for both brands.
If one of your competitors experiences a traffic spike and the other doesn’t, ask yourself: What were they doing differently? Can you replicate or adapt a similar strategy?
Here’s what you should do next:
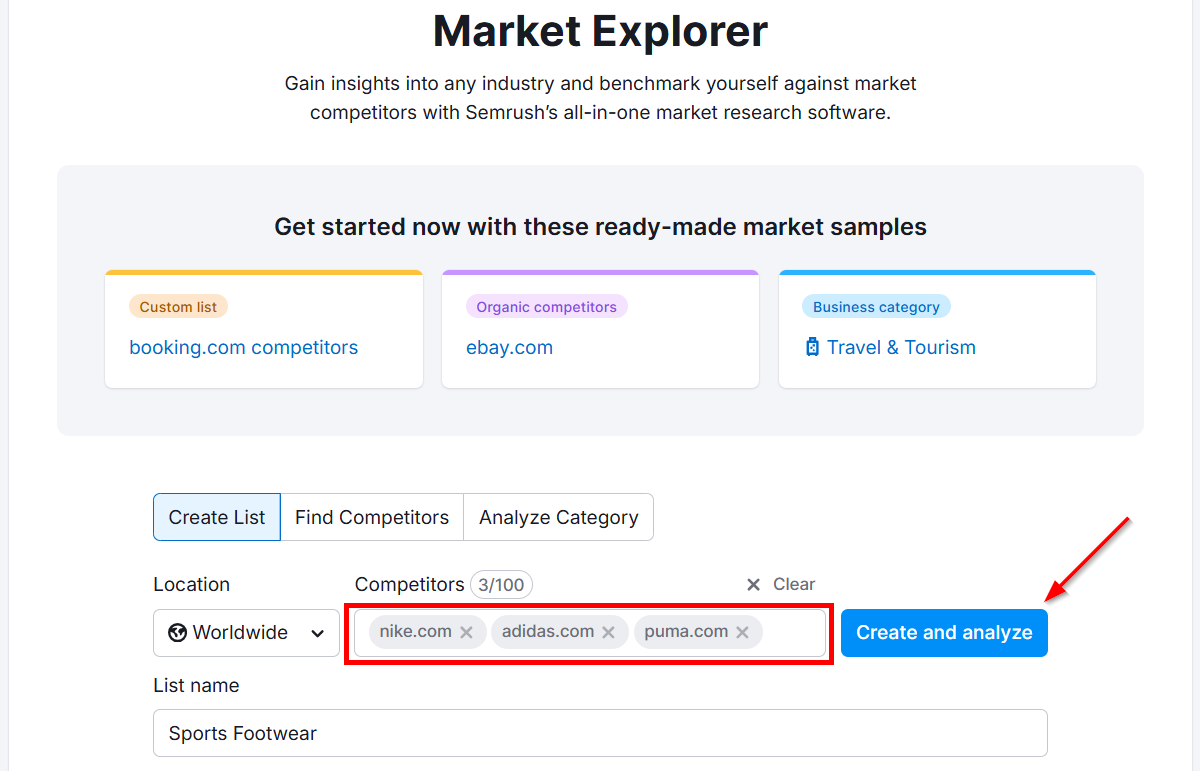
Open Semrush Market Explorer (it’s under the Trends tab in the left sidebar).
Type three competitor sites in the search bar.
Click Create and analyze.
Next, scroll down to the Top Keywords section to view the keywords that generated the most traffic during the selected time period.
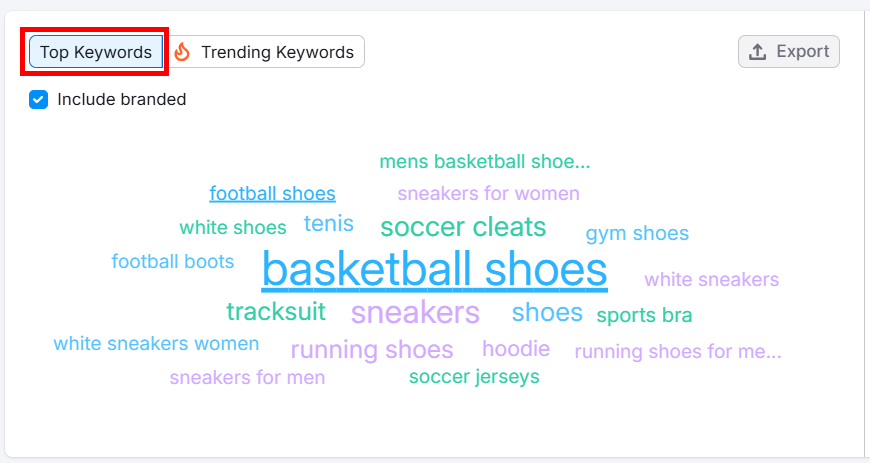
You can also select Trending Keywords to find the terms with the biggest volume increases during the selected time range.
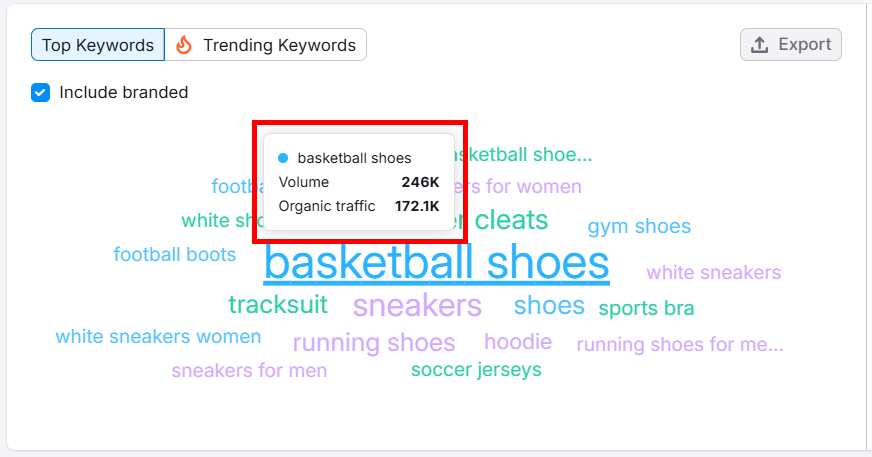
Hover over each keyword for more insights—this can reveal emerging opportunities you can tap into before they hit peak popularity.
By tracking competitor insights, you can spot emerging trends early and tailor your content accordingly.
8. Find Brand-New Keyword Ideas
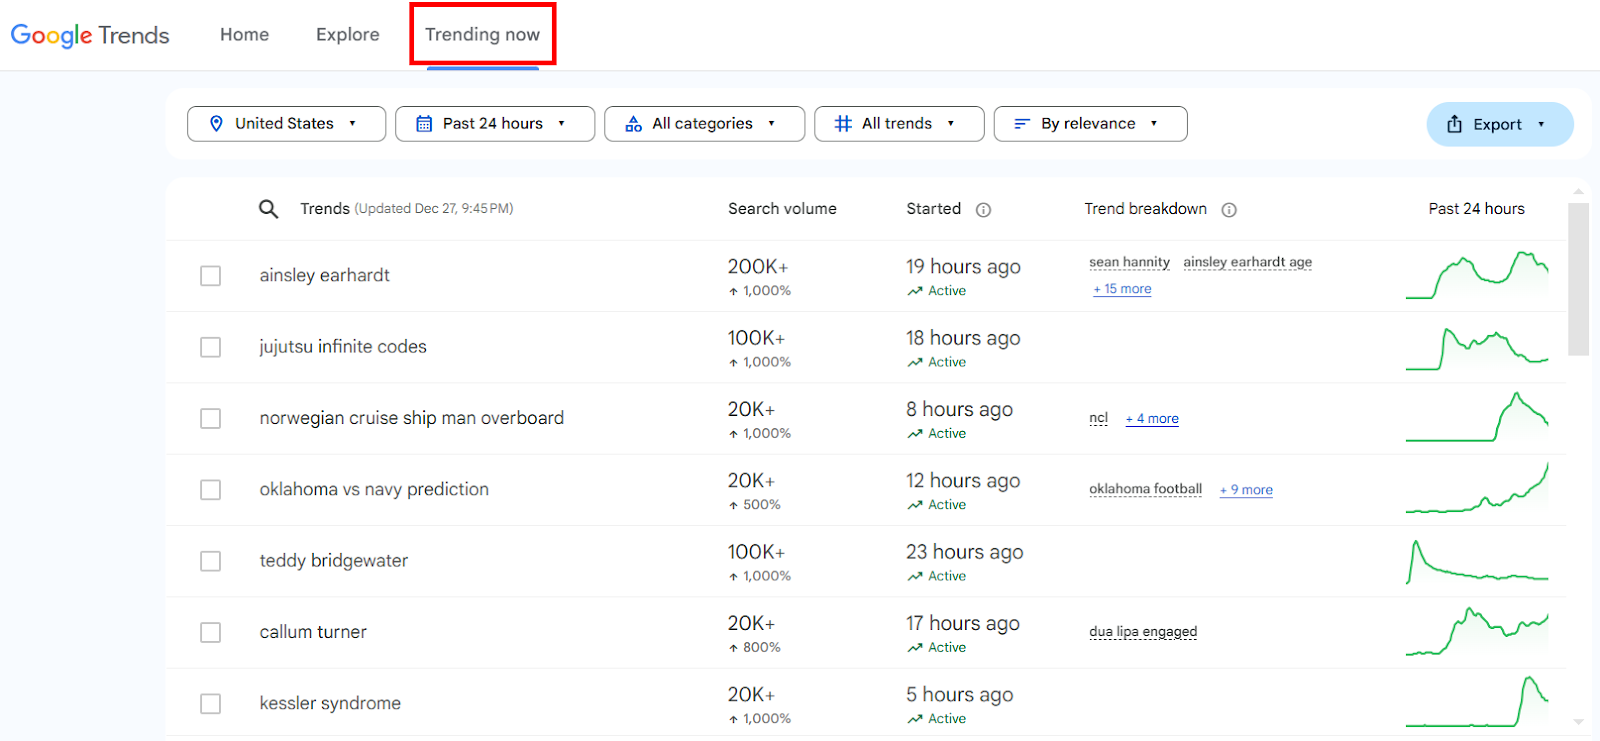
One lesser-known way I use Google Trends for SEO is by checking out the Trending Now feature.
You don’t have to search for a specific keyword. It just shows real-time data for topics that have experienced a sharp increase in searches over the last 24 hours.
But there’s a catch!
Many of these surging keywords are short-term spikes—think viral news stories or the latest celebrity gossip. It often doesn’t make sense to build an entire piece of content around such fleeting trends.
But once in a while, you’ll spot a topic with staying power.
For example, a few years ago, I noticed the term “PS5” rapidly gaining traction. It was new, it was hot, and it wasn’t something you’d easily find in most traditional keyword tools at the time.
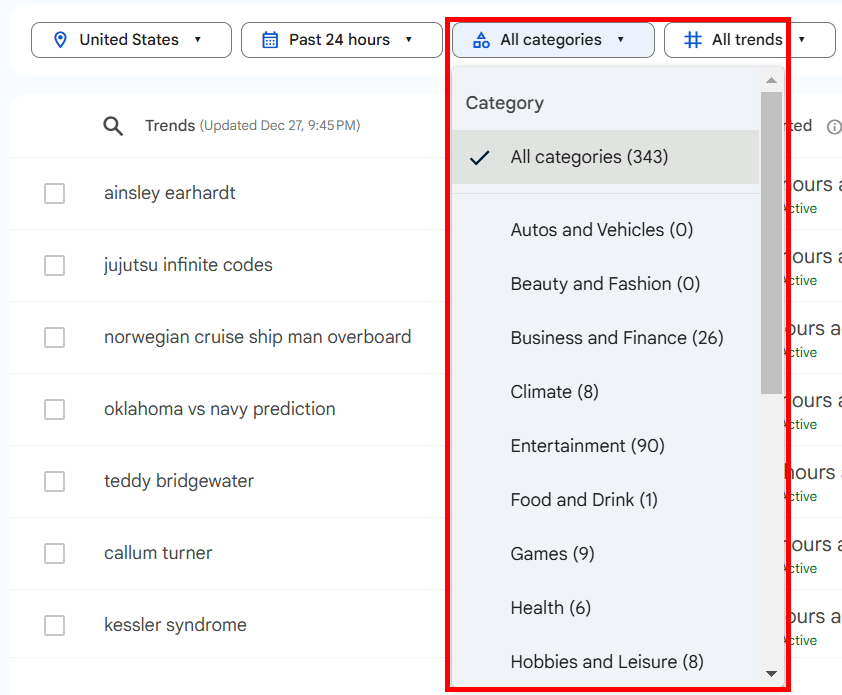
Pro Tip: Use the Category drop-down in Trending Searches to focus on your industry. It helps filter out unrelated news and find emerging topics to cover.
Why Use Google Trends?
I’ll be honest—before I discovered Google Trends, I relied a lot on gut feelings and secondhand advice for my keyword research. Sometimes it worked out– other times my content just fell flat.
But with Google Trends data, I could see a real-time snapshot of what people are actually searching for right now!
Here’s why I use Google Trends and why you should too:
↳ Google Trends shows how interest in a keyword changes. This can help you plan for seasonal peaks or decide if a term is worth investing in long-term.
↳ Google Trends highlights “Related Queries” and labels some of them as “Breakout” if they are experiencing a sudden, significant increase in search volume. With these features, you can spot rising trends early and create content before the competition catches on.
↳ By analyzing interest by location, you can adjust your SEO or PPC strategy to target areas where demand is highest.
↳ It lets you compare up to five terms side-by-side to see what’s gaining traction and prioritize your efforts.
↳ Knowing when people search for specific terms helps you align your blog posts and campaigns with what’s relevant right now. (I have my entire year’s seasonal content planned, thanks to Google Trends).
↳ Need fast insights? Google Trends offers up-to-the-minute data, perfect for jumping on trending topics or monitoring campaigns.
But, Google Trends Has Its Limitations, Too!
While Google Trends is a great tool for SEO and keyword research, it’s not without its limitations.
↳ It Shows Trends, Not Exact Numbers: Google Trends gives you a relative score (0–100) for keyword popularity, not actual search volumes like “1,000 searches per month.” To get precise data, I suggest combining it with tools like Google Keyword Planner or Semrush.
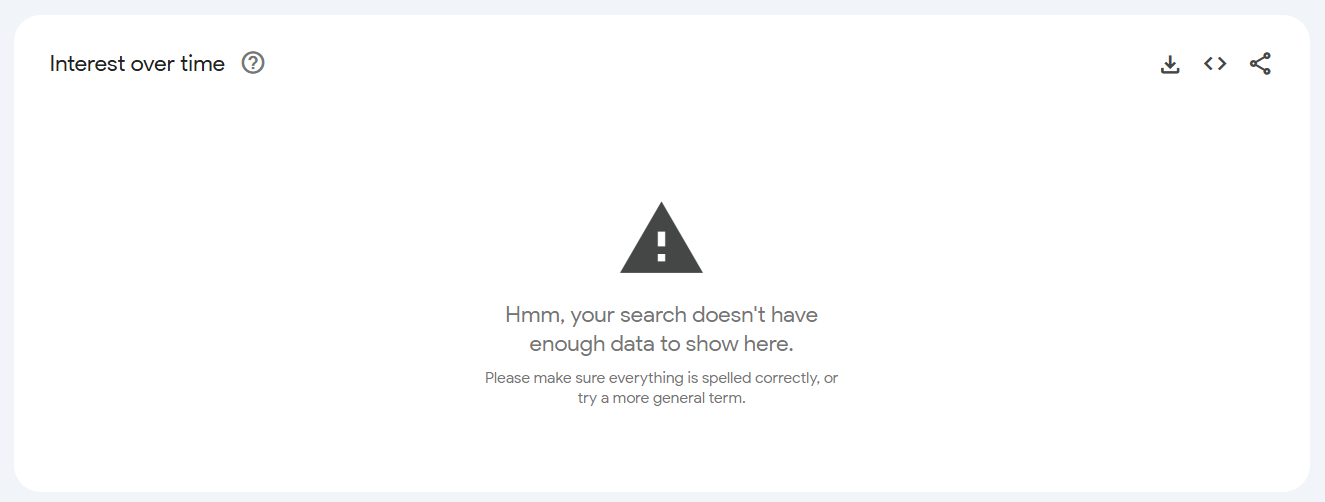
↳ Struggles With Low-Volume Keywords: For niche or new keywords, Google Trends might not show any data. You could miss hidden opportunities, so consider using other tools to find these “hidden gem” terms.
↳ Limited Historical Data for Some Terms: Although Google Trends goes back to 2004, not every keyword has a detailed history—especially newer or less popular ones. This can make it harder to spot long-term patterns.
↳ Lacks Context: The tool doesn’t explain why a keyword is trending or what searchers are looking for. You’ll need other tools to figure out user intent and create relevant content.
↳ Focuses on Google: Google Trends mainly covers Google Search. While it has a YouTube filter, it’s less helpful for platforms like Bing, Amazon, or social media.
↳ Regional Data Isn’t Always Granular: For hyper-local SEO, Google Trends might lump data together if there isn’t enough search volume in a specific area. You’ll need more localized research for detailed insights.
↳ Short-Term Data Can Be Volatile: Daily or hourly trends might show spikes that don’t reflect the bigger picture. So, be cautious when using short-term data to make decisions.
The bottom line is that since Google Trends shows relative data without much context. You need to pair it with other tools for a complete SEO strategy.
Turning Google “Trends” into Results
Google Trends is one of the best tools to find trendy keywords and stay ahead of your competitors. For the best results, pair it with other Google SEO tools:
↳ How to Find Google Ads keywords with Google Keyword Planner
↳ How to Use Google Search Console to for Keyword Research
↳ How to Use Google Keyword Planner for Keyword Research
Frequently Asked Questions
Technical Features and Functionality
Google doesn’t offer an official API for Trends but provides two datasets: real-time (past week) and non-real-time (back to 2004). I still find these datasets quite useful, although they require manual or third-party extraction. I’ve seen some unofficial workarounds, but they’re not officially supported and can break without notice, so I wouldn’t recommend using them.
Google Trends determines search interest by taking the total search volume for a query within a chosen timeframe and location, then comparing it to overall search traffic. It shows popularity relative to other searches—not exact numbers.
If a keyword caries in Google Trends, it usually means the keyword’s popularity is seasonal or influenced by external factors—like product launches, news events, or marketing campaigns.
Primarily, Google Trends reflects Google Search data (plus YouTube and Google Shopping). If you need insights from Amazon or Bing, I recommend pairing Google Trends data with tools specific to those platforms—like Amazon Best Sellers or Bing Webmaster Tools.
Finding Keywords and Trends
Open Google Trends and enter a keyword or topic in the search box. Google Trends displays search interest over time on a 0–100 scale, where higher numbers mean more searches. Then, go to the Explore section and filter by time, location, and category. I look for keywords with high or rising popularity to find valuable topics to target.
Trending searches on Google change everyday. Google’s Trending Now page shows real-time and daily snapshots of what’s popular. It’s a quick way to spot trending events or viral topics your audience might be interested in.
They change constantly. I usually consult Google’s Year in Search for annual highlights, or I check the Trending Now section to see what’s hot on a daily basis.
After you type a main keyword into Explore, scroll down to Related Topics and Related Queries section. Check labels like “Rising” or “Breakout”, since they indicate terms that are gaining momentum quickly—sometimes before the competition catches on.
If you don’t see data, your keyword might be too niche or too new. I often try broadening my search term, switching to a longer timeframe, or checking Related Topics. If that still doesn’t help, you can always use tools like Semrush or Ahrefs to confirm whether there’s any hidden demand.
Google Trends is great for spotting trends and seasonal patterns. But I wouldn’t recommend using it alone for keyword research because it doesn’t provide actual search volume data. You can pair it with other keyword tools (like Semrush, Ahrefs, or Google Keyword Planner) for a complete picture, including search volume and competition levels.
Definitely. By switching the default Web Search filter to YouTube Search, you can see which topics are hot on YouTube. You can even compare different video ideas to figure out what’s most likely to attract viewers.
You can evaluate its interest over time on Google Trends. If it’s holding steady or climbing, that signals long-term potential. If it’s just a quick spike, it might fizzle out before you can capitalize on it with meaningful content. Also, look at Related Queries for long-tail variations—these can signal more lasting opportunities.
Content Strategy and Creation
Absolutely. When you spot a rising or breakout query in your niche, create a blog post or video around it. That way, your content is ready to capture traffic at the peak of its popularity.
It’s a real-time pulse on public interest. If you see something relevant to your audience, I’ll suggest producing content immediately—or boost your existing content—to ride that wave of interest.
Enter a broad product category (e.g., “running shoes”) into Google Trends. Look at the interest over time graph to see if spikes align with seasonal events, new releases, or holiday shopping periods. That can help you schedule marketing campaigns for maximum impact.
Trending Now searches can be hit-or-miss. Many will be fleeting news stories or viral fads. However, you might find emerging topics with long-term interest every once in a while. So, if you spot a new term that aligns with your niche, it’s worth exploring further.
Look at the peaks in Google Trends’ historical data for your keyword, then publish content a few weeks before that spike. This way, your content has time to rank and attract visitors once demand surges.
Local SEO and Audience Targeting
Absolutely. By focusing on the “Interest by Subregion” feature, you can see where interest in your keyword is strongest. Then, target those areas with location-specific content or ads.
It depends on your niche. If you’re in a fast-paced industry (e.g., tech or entertainment), you might check it weekly or even daily. For more stable industries (like B2B services), a monthly or quarterly review might be enough.
Competitive Analysis
Yes. You can use the Compare feature to stack up to five keywords or brand names. That’s how you gauge which ones dominate search interest over a specific period.
Use the Compare feature to track up to five competitors or related terms. Note spikes in their search interest and cross-check with their promotions, new product launches, or big campaigns. Replicate (and improve on) what’s working for them.